Lithuania Key Figures
- Population:
- 2.89 million
- GDP growth rate:
- 2.77 %/year
- Energy independence:
- 33.2%
Data of the last year available: 2024
- Total consumption/GDP:*
- 76.9 (2015=100)
- CO2 Emissions:
- 3.82 tCO2/cap
- Rate of T&D power losses:
- 6.66%
* at purchasing power parity
View all macro and energy indicators in the Lithuania energy report
Lithuania Energy News
View all news, archive your new and create your own daily newsletters only on your topics/countries of interest with Key Energy Intelligence
Lithuania Energy Research
- Lithuania's Energy & Climate Policy Framework: Lithuania aims for 55% renewable energy by 2030 and 95% by 2050, with a focus on wind and solar power. The country has liberalised its energy markets, synchronised with the EU grid, and targets full fossil fuel independence by 2050. Support mechanisms include subsidies, auctions, and energy efficiency programmes.
- Lithuania's Energy Companies: Ignitis Group dominates Lithuania's energy sector, operating power generation, distribution, and gas supply. State-owned EPSO-G holds stakes in key transmission companies Litgrid and Amber Grid. The oil sector is led by Orlen Lietuva, operating the sole refinery and major terminals.
- Lithuania's Energy Supply & Demand: In 2024, Lithuania's energy supply saw a 3% rise in primary consumption to 7.2 Mtoe, with oil and biomass leading the mix. Renewables dominated electricity generation, while imports met nearly half of power demand. Gas imports ceased from Russia, and overall consumption trends reflected a shift towards cleaner energy sources.
- Lithuania's Energy Use & Price by Sector: "Energy prices surged, then fell, with household gas costs rising fivefold by 2023. Final energy demand grew 6% in 2024, with oil, gas, and electricity leading consumption. Transport and buildings each accounted for 36.5% of demand, while industry saw a 5% annual decline. Electricity and gas prices fluctuated significantly, with household costs remaining above EU averages."
- Lithuania's Issues & Prospects: Lithuania is expanding its energy infrastructure, with significant investments in renewable energy, nuclear, and gas projects, alongside grid enhancements to support increased electricity demand and interconnections with neighbouring countries.
Benefit from up to 2 000 up-to-date data series for 186 countries in Global Energy & CO2 data
A data overview is available in the global energy statistics app
Lithuania Total Energy Production & Consumption
Total primary energy consumption increased by 3% in 2024 to 7.2 Mtoe, after stability in 2023 and a sharp 9% reduction in 2022. It increased steadily by 1.5% per year from 2013 to 2021, peaking at 7.8 Mtoe in 2021. In 2024, total energy consumption per capita was 2.5 toe (10% below the EU average).
The primary energy consumption mix is dominated by oil (42% in 2024), followed by biomass and waste (23%), natural gas (19%), and primary electricity (12%). Thes shares of oil and biomass are increasing (+ 6 and 9 pp since 2010), while the share of gas dropped by 17 points.
Source: Lithuania energy report
Interactive Chart Lithuania Total Energy Production & Consumption
Source: Global Energy & CO2 data
Benefit from up to 2 000 up-to-date data series for 186 countries in Global Energy & CO2 data
View the detailed fondamentals of the market at country level (graphs, tables, analysis) in the Lithuania energy report
Lithuania Oil Production & Consumption
Apart from a marginal production of around 30 kt, Lithuania imports all its crude oil (9 Mtin 2023, mainly from Saudi Arabia (40%), followed by Norway (27%) and the United States (24%). It is refined at the Mazeikiai refinery which has a capacity of 15 Mt/year, and which operates at around 2/3 of its capacity. The country is a net exporter of oil products (6.9 Mt of exports for 0.9 Mt of imports in 2023).
Source: Lithuania energy report
Interactive Chart Lithuania Crude Oil Production & Consumption
Source: Global Energy & CO2 data
Interactive Chart Lithuania Refined Oil Products Production & Consumption
Source: Global Energy & CO2 data
Benefit from up to 2 000 up-to-date data series for 186 countries in Global Energy & CO2 data
Additionally, for more detailed information on refineries, you can request a sample of our EMEA Refineries Dataset
Lithuania Natural Gas Production & Consumption
Lithuania imports all its natural gas.
The transmission network is connected to Latvia (export and import capacity of 3.7 bcm/year in 2023) and, since May 2022, to Poland through the GIPL gas pipe. The pipeline connected to Belarus is no longer used (capacity of 10 bcm/year).
In 2024, Amber Grid completed the Lithuania-Latvia Interconnector (ELLI) project at a total cost of €10m (€4.3m for Lithuania). This project increased the interconnection capacity by 40%.
Source: Lithuania energy report
Interactive Chart Lithuania Gas Production & Consumption
Source: Global Energy & CO2 data
Benefit from up to 2 000 up-to-date data series for 186 countries in Global Energy & CO2 data
Additionally, for more detailed information on the LNG trade, you can request a sample of our EMEA LNG Trade Dataset
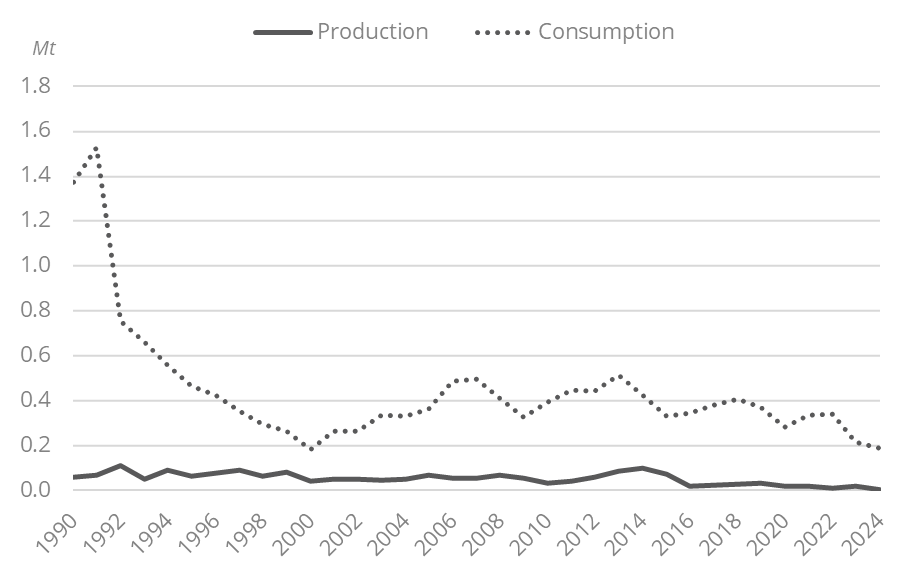
Lithuania Coal and Lignite Production & Consumption
Coal and lignite production is negligible; it peaked in 2014 at 0.1 Mtoe but has since declined sharply, falling to under 0.01 Mtoe in 2024. Coal consumption is marginal (0.2 Mtoe) and has been declining rapidly since 2012 by 9%/year.
Graph: Coal Production & Consumption
Source: Lithuania energy report
Interactive Chart Lithuania Coal and Lignite Production & Consumption
Source: Global Energy & CO2 data
Benefit from up to 2 000 up-to-date data series for 186 countries in Global Energy & CO2 data
View the detailed consumption trends at country level (graphs, tables, analysis) in the Lithuania energy report
Lithuania Renewable in % Electricity Production
The target of the National Renewable Energy and Climate Action Plan of a 23% share of renewables in final energy consumption has been exceeded since 2016. The target set for renewables in 2030 in the updated NECPis 55% of final consumption, and 95% in 2050.In 2023, the share of renewables was 32%, of which 54% for heating, 37% for power, and 7% for transport.
In 2021, the government announced the expected investment (€10 bn) to bring the share of green power to 50% by 2025 and 100% by 2050.
Source: Lithuania energy report
Interactive Chart Lithuania Share of Renewables in Electricity Production (incl hydro)
Source: Global Energy & CO2 data
Benefit from up to 2 000 up-to-date data series for 186 countries in Global Energy & CO2 data
Learn more about renewables in the European Battery Market Analysis
Lithuania GHG emissions and CO2 emissions
Lithuania aims to cap the increase in GHG emissions in sectors covered by the EU ETS to 15% compared to the 2005 level (15.5 MtCO2eq). Ahead of the COP 21, Lithuania's NDC includes a binding GHG emission reduction of 55% by 2030 compared to 1990.
Source: Lithuania energy report
Interactive Chart Lithuania CO2 emissions
Source: Global Energy & CO2 data
Benefit from up to 2 000 up-to-date data series for 186 countries in Global Energy & CO2 data
View the detailed consumption trends at country level (graphs, tables, analysis) in the Lithuania energy report