Ireland Key Figures
- Population:
- 5.40 million
- GDP growth rate:
- 1.22 %/year
- Energy independence:
- 21.5%
Data of the last year available: 2024
- Total consumption/GDP:*
- 39.3 (2015=100)
- CO2 Emissions:
- 5.77 tCO2/cap
- Rate of T&D power losses:
- 7.38%
* at purchasing power parity
View all macro and energy indicators in the Ireland energy report
Ireland Energy News
View all news, archive your new and create your own daily newsletters only on your topics/countries of interest with Key Energy Intelligence
Ireland Energy Research
- Ireland's Energy & Climate Policy Framework: Ireland aims for a 55% GHG reduction by 2030, with a EUR 64/CO2 carbon tax in 2025. The DCCAE oversees energy policy, while the CRU regulates the sector. The EPA manages emissions and shale gas. Ireland's updated NECP targets 43% renewables by 2030, with significant investments in offshore wind and energy efficiency. The country also plans to achieve net-zero emissions by 2050.
- Ireland's Energy Companies: ESB leads Ireland's power sector, owning transmission and distribution networks. Centrica dominates the gas market. Key players include SSE Airtricity and Energia, with investments in renewables. EirGrid manages transmission, while Gas Networks Ireland oversees gas pipelines. Peat production has ceased, focusing on renewables.
- Ireland's Energy Supply & Demand: Ireland's energy mix is shifting, with wind power surging to 37% by 2024, while gas remains dominant. Total energy consumption has slightly declined since 2021, with oil and gas being the primary sources. The country's energy independence has decreased due to depleted reserves and reduced peat production. Electricity generation has seen a notable shift towards renewables, particularly wind, and CO₂ emissions per capita have decreased significantly.
- Ireland's Energy Use & Price by Sector: In 2024, final energy consumption rose by 5% to 11.6 Mtoe, with residential, services, and agriculture leading at 42%, followed by transport (37%) and industry (19%). Gas prices doubled since 2022, while electricity and gas costs fluctuated. Oil dominated transport (91%), and electricity led in residential sectors (45%).
- Ireland's Issues & Prospects: Ireland faces electricity capacity deficits by 2032, driven by rising demand, particularly from data centres. Significant wind, hydro, and gas projects are under development, alongside grid upgrades and interconnections. Offshore wind targets aim for 5 GW by 2030 and 20 GW by 2040. Gas demand is projected to decline, while green hydrogen initiatives advance.
Benefit from up to 2 000 up-to-date data series for 186 countries in Global Energy & CO2 data
A data overview is available in the global energy statistics app
Ireland Total Energy Production & Consumption
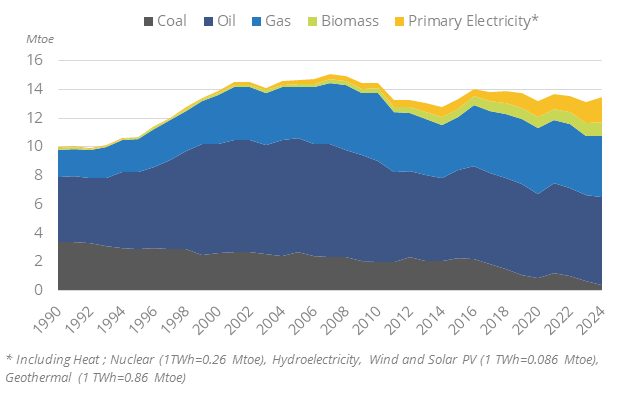
Total energy consumption has been decreasing slightly since 2021 (-0.4%/year), reaching 13.5 Mtoe in 2024. It was rather stable over 2016-2019 at around 14 Mtoe, after rapid growth between 2014 and 2016 (+4.4%/year) thanks to the economic recovery, and decreasing by more than 2%/year between 2007 and 2014 due to the economic slowdown.
Graph: Primary Consumption Trends by Energy Source (Mtoe)
Source: Ireland energy report
Interactive Chart Ireland Total Energy Production & Consumption
Source: Global Energy & CO2 data
Benefit from up to 2 000 up-to-date data series for 186 countries in Global Energy & CO2 data
View the detailed fondamentals of the market at country level (graphs, tables, analysis) in the Ireland energy report
Ireland Oil Production & Consumption
There is currently no oil production. Providence Resources was the first company to report commercially viable oil flow from its Barryroe well in 2012.
Ireland imports all its crude oil and about 90% of its refined product needs. Ireland's oil dependency is among the highest in the EU.
Ireland has just one oil refinery, the Whitegate refinery located in Cork, with a capacity of 75 kb/d. It processes crude, mainly sourced from the North Sea, North Africa, and West Africa.
Graph: Crude Oil Production & Consumption (Mt)
Source: Ireland energy report
Interactive Chart Ireland Crude Oil Production & Consumption
Source: Global Energy & CO2 data
Interactive Chart Ireland Refined Oil Products Production & Consumption
Source: Global Energy & CO2 data
Benefit from up to 2 000 up-to-date data series for 186 countries in Global Energy & CO2 data
Additionally, for more detailed information on refineries, you can request a sample of our EMEA Refineries Dataset
Ireland Natural Gas Production & Consumption
Natural gas production has decreased by 2/3 since its peak in 2017 (3.5 bcm) due to the closure of the Kinsale Area gas fields. The commissioning of the Corrib field in 2016 allowed the country to keep a production of 1.1 bcm in 2024.
The country's gas imports have nearly doubled since 2018, reaching 3.9 bcm in 2024, to cover the decreasing production. Over 2010-2015, they fluctuated between 4 and 5 bcm. Imports account for 76% of the gas consumed (2023). All the imported gas comes through the UK.
Source: Ireland energy report
Interactive Chart Ireland Gas Production & Consumption
Source: Global Energy & CO2 data
Benefit from up to 2 000 up-to-date data series for 186 countries in Global Energy & CO2 data
Additionally, for more detailed information on the LNG trade, you can request a sample of our EMEA LNG Trade Dataset
Ireland Renewable in % Electricity Production
SEAI is the agency in charge of the implementation of the renewable energy policy.
In its final NECP (2024), Ireland increased its target of renewables' share in final energy consumption to 43% in 2030 (up from 34.1%). In 2023, this share was 15%, of which 38.9% was for electricity, 7.2% for heat, and 7.6% for transport; the share of renewables in transport has been divided by almost a factor of 2 since 2020, driving down the overall share of renewables (-3 pp since 2020).
Source: Ireland energy report
Interactive Chart Ireland Share of Renewables in Electricity Production (incl hydro)
Source: Global Energy & CO2 data
Benefit from up to 2 000 up-to-date data series for 186 countries in Global Energy & CO2 data
Learn more about renewables in the European Battery Market Analysis
Ireland GHG emissions and CO2 emissions
In 2023, GHG emissions decreased by 4% to 63 MtCO2e (including LULUCF), which is around their 1990 level. In 2022, they decreased by 9%, after increasing by 5% in 2021. Emissions have decreased by 2%/year on average since 2016, after increasing by 1.6%/year over2012-2016. These emissions fell by 15%, from their 2005 peak level of 78 MtCO2 to 65 MtCO2 in 2012, because of the economic crisis.
Source: Ireland energy report
Interactive Chart Ireland CO2 emissions
Source: Global Energy & CO2 data
Benefit from up to 2 000 up-to-date data series for 186 countries in Global Energy & CO2 data
View the detailed consumption trends at country level (graphs, tables, analysis) in the Ireland energy report