Gabon Key Figures
- Population:
- 2.48 million
- GDP growth rate:
- 2.45 %/year
- Energy independence:
- 100%
Data of the last year available: 2023
- Total consumption/GDP:*
- 95.0 (2005=100)
- CO2 Emissions:
- 0.80 tCO2/capita
- Rate of T&D power losses:
- 15.6%
* at purchasing power parity
View all macro and energy indicators in the Gabon energy report
Gabon Energy News
View all news, archive your new and create your own daily newsletters only on your topics/countries of interest with Key Energy Intelligence
Gabon Energy Research
Benefit from up to 2 000 up-to-date data series for 186 countries in Global Energy & CO2 data
A data overview is available in the global energy statistics app
Gabon Total Energy Production & Consumption
Energy consumption per capita is around 1.1 toe, including almost 896 kWh of electricity (2023).
Graph: CONSUMPTION TRENDS BY ENERGY SOURCE (Mtoe)
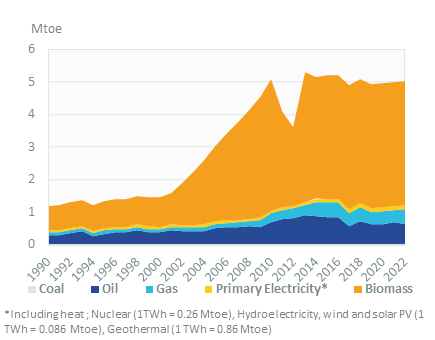
Total consumption has increased by 3%/year from 2019 to 2022 and remained stable in 2023 (2.7 Mtoe). It was stable from 2014 to 2019, after a rapid increase between 2000 and 2010 (13%/year, i.e. a 3.5-fold rise).
Source: Gabon energy report
Interactive Chart Gabon Total Energy Production & Consumption
Source: Global Energy & CO2 data
Benefit from up to 2 000 up-to-date data series for 186 countries in Global Energy & CO2 data
View the detailed fondamentals of the market at country level (graphs, tables, analysis) in the Gabon energy report
Gabon Oil Production & Consumption
Oil production increased by around 9% in 2023 to 11 Mt, after a 3% rise in 2022. This follows a sharp drop in 2021 (-7%) and a progression since 2018 thanks to the exploitation of recent discoveries and the effort of companies specialized in maximizing the value of mature fields. Oil production is mainly offshore (81% of the total area). Previously, the country had recorded a 25% decrease in production over 2010-2018 (-3%/year) and 30% drop between 1997 and 2002, due to the falling production of the main fields and the decline in reserves.
Source: Gabon energy report
Interactive Chart Gabon Crude Oil Production & Consumption
Source: Global Energy & CO2 data
Interactive Chart Gabon Refined Oil Products Production & Consumption
Source: Global Energy & CO2 data
Benefit from up to 2 000 up-to-date data series for 186 countries in Global Energy & CO2 data
Additionally, for more detailed information on refineries, you can request a sample of our EMEA Refineries Dataset
Gabon Natural Gas Production & Consumption
Since the commissioning of a gas pipeline connecting the field of Diga to the power plants of Port-Gentil and Akournam in 2008, gas has been used for electricity production. Delivered volumes are about 0.4 bcm. More than 75% of the gross gas production is used in power plants and 10% is flared.
Source: Gabon energy report
Interactive Chart Gabon Gas Production & Consumption
Source: Global Energy & CO2 data
Benefit from up to 2 000 up-to-date data series for 186 countries in Global Energy & CO2 data
Additionally, for more detailed information on the LNG trade, you can request a sample of our EMEA LNG Trade Dataset
Gabon GHG emissions and CO2 emissions
In its NDC (2016), Gabon set the commitment to reduce its GHG emissions by at least 50% in 2025 as compared to a BAU scenario, including LULUCF (Land Use, Land-Use Change and Forestry), which accounts for more than 60% of direct emissions, but excluding carbon stocks in forests (i.e. sinks). The expected emissions reduction should reach 62% in 2025 (LULUCF included) vs BAU scenario. In its revised NDC (2022), the country committed unconditionally to remain carbon neutral in 2050 and to pursue a minimum net absorption of 100 Mt of CO2 annually.
Source: Gabon energy report
Interactive Chart Gabon CO2 emissions
Source: Global Energy & CO2 data
Benefit from up to 2 000 up-to-date data series for 186 countries in Global Energy & CO2 data
View the detailed consumption trends at country level (graphs, tables, analysis) in the Gabon energy report