Croatia Key Figures
- Population:
- 3.87 million
- GDP growth rate:
- 3.81 %/year
- Energy independence:
- 42.8%
Data of the last year available: 2024
- Total consumption/GDP:*
- 77.5 (2015=100)
- CO2 Emissions:
- 4.32 tCO2/cap
- Rate of T&D power losses:
- 7.30%
* at purchasing power parity
View all macro and energy indicators in the Croatia energy report
Croatia Energy News
View all news, archive your new and create your own daily newsletters only on your topics/countries of interest with Key Energy Intelligence
Croatia Energy Research
- Croatia's Energy & Climate Policy Framework: Croatia aims for 42.5% renewables by 2030, with policies overseen by the Ministry of Economy and HERA. The energy market is liberalised, with 55% of customers on the liberalised market in 2024. Croatia is phasing out coal by 2033 and has set ambitious GHG reduction targets. Support mechanisms for renewables include tenders and premiums, with a focus on solar and wind energy. The country is also exploring nuclear and green hydrogen options. Energy efficiency measures and smart meter rollouts are in progress, with a goal of reducing energy intensity.
- Croatia's Energy Companies: HEP dominates Croatia's electricity market, with 70% generation and 90% retail sales. INA leads oil and gas production. HEP also supplies 55% of gas retail market.
- Croatia's Energy Supply & Demand: Croatia's energy supply relies heavily on hydropower, with declining oil and gas production. Total energy consumption grew 1.5% in 2024, with renewables covering 30% of demand. The power mix is dominated by hydropower, while oil and gas imports are increasing. CO2 emissions are below global averages, with a target of net-zero by 2050.
- Croatia's Energy Use & Price by Sector: Croatia's final energy demand has risen rapidly since 2022, with oil as the primary source. Industrial electricity prices doubled by 2024, while transport and residential sectors also saw significant changes in consumption and pricing. Government measures aimed to mitigate price surges.
- Croatia's Issues & Prospects: Croatia plans to expand its Krk LNG terminal capacity and integrate hydrogen into its gas networks. Energy consumption is projected to rise slightly until 2030, then stabilise. Electricity capacity will grow, with significant investments in wind, solar, and hydropower. Gas and coal projects face delays, while geothermal and transmission infrastructure projects advance. Green hydrogen initiatives are also underway.
Benefit from up to 2 000 up-to-date data series for 186 countries in Global Energy & CO2 data
A data overview is available in the global energy statistics app
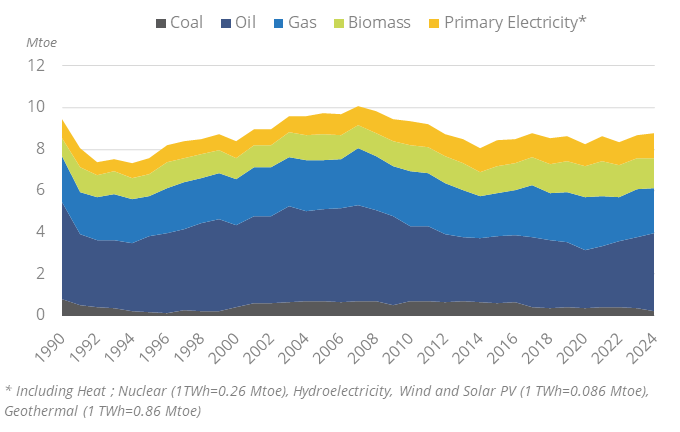
Croatia Total Energy Production & Consumption
Total energy consumption grew by 1.5% in 2024 to 8.8 Mtoe after a 3.2% decrease in 2022 and a 3.9% rebound in 2023. It declined by almost 1%/year on average between 2010 and 2019 and was back to its 2019 level in 2023. Total consumption per capita reached 2.3 toein 2024, which is 18% below the EU average.
Graph: Primary Consumption Trends by Energy Source
Source: Croatia energy report
Interactive Chart Croatia Total Energy Production & Consumption
Source: Global Energy & CO2 data
Benefit from up to 2 000 up-to-date data series for 186 countries in Global Energy & CO2 data
View the detailed fondamentals of the market at country level (graphs, tables, analysis) in the Croatia energy report
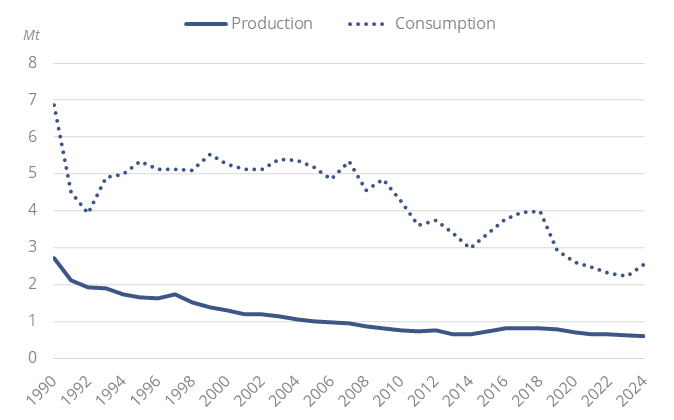
Croatia Oil Production & Consumption
Crude oil production is low and, after a plateau at around 800 kt between 2016 and 2018, is declining (-5%/year between 2018 and 2023), reaching 602 kt in 2024.
Graph: Crude Oil Production & Consumption
Petroleum Infrastructure
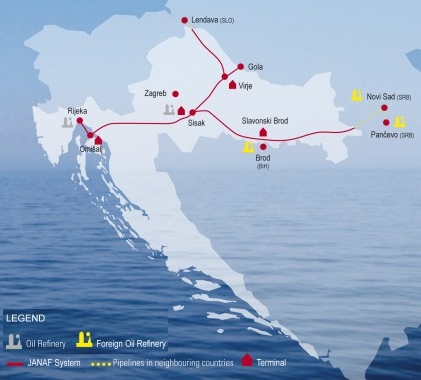
Source: JANAF
Source: Croatia energy report
Interactive Chart Croatia Crude Oil Production & Consumption
Source: Global Energy & CO2 data
Interactive Chart Croatia Refined Oil Products Production & Consumption
Source: Global Energy & CO2 data
Benefit from up to 2 000 up-to-date data series for 186 countries in Global Energy & CO2 data
Additionally, for more detailed information on refineries, you can request a sample of our EMEA Refineries Dataset
Croatia Natural Gas Production & Consumption
Gas production has been declining since its peak level of 2.9 bcm in 2007, with an acceleration since 2015 (-11%/year), to 691 mcm in 2023. However, it rebounded by 9% to 756 mcm in 2024. In July 2025, INA launched gas production at the Jamarice-183 (JAM-183) well, located within the Jamarice exploitation field near Novska.
Source: Croatia energy report
Interactive Chart Croatia Gas Production & Consumption
Source: Global Energy & CO2 data
Benefit from up to 2 000 up-to-date data series for 186 countries in Global Energy & CO2 data
Additionally, for more detailed information on the LNG trade, you can request a sample of our EMEA LNG Trade Dataset
Croatia Coal and Lignite Production & Consumption
All the coal is imported (0.3 Mt in 2024, half its 2023 level and 73% below its 2010 level) as Croatia stopped producing coal in 1997. Coal consumption halved from 2010 to 2018, averaging 0.6-0.7 Mt until 2023 (depending on hydropower availability) and even fell by 1/3 in 2024 to 0.4 Mt. Previously, coal consumption more than tripled between 1999 and 2004 following the commissioning of the 210 MW Plomin-2 power plant and remained broadly stable at around 1.1 Mt/year until 2016; it fell by 40% in 2017 after a fire at Plomin-1, where operations have been suspended.
Source: Croatia energy report
Interactive Chart Croatia Coal and Lignite Production & Consumption
Source: Global Energy & CO2 data
Benefit from up to 2 000 up-to-date data series for 186 countries in Global Energy & CO2 data
View the detailed consumption trends at country level (graphs, tables, analysis) in the Croatia energy report
Croatia Renewable in % Electricity Production
The final updated NECP (2025) raised the 2030 target for the share of renewables in the final energy consumption to 42.5%, including 76.7% for electricity, 47.1% for heating and cooling, and 24.6% in transport. It should reach 53-65% in 2050 (Energy Development Strategy, 2020). In 2024, renewables covered 27% of final energy consumption, including 58% for electricity, 35% for heating and cooling and 0.9% in transport. The 2020 target of the National Renewable Energy Action Plan (NREAP, 2013) for a share of 20% of renewables was largely exceeded (by 11 points).
Source: Croatia energy report
Interactive Chart Croatia Share of Renewables in Electricity Production (incl hydro)
Source: Global Energy & CO2 data
Benefit from up to 2 000 up-to-date data series for 186 countries in Global Energy & CO2 data
Learn more about renewables in the European Battery Market Analysis
Croatia GHG emissions and CO2 emissions
In its final updated NECP, Croatia aims to cut its GHG emissions by 62% in 2030 (compared with 2005 level) in ETS sectors and by 16.7% in non-ETS sectors (up from 43% and 7%, respectively, in the initial NECP). For the LULUCF sector, it targets a net removal of 5.5 MtCO2eq in 2030 (compared to 2005).
Croatia's Strategy for Low Emissions Development by 2030 with an outlook by 2050 aims to cut GHG emissions by 64-74% in 2050 compared to 1990. A strategy for achieving larger emission reductions by 2030 and reaching carbon neutrality in the energy sector by 2050 was confirmed in 2021.
Source: Croatia energy report
Interactive Chart Croatia CO2 emissions
Source: Global Energy & CO2 data
Benefit from up to 2 000 up-to-date data series for 186 countries in Global Energy & CO2 data
View the detailed consumption trends at country level (graphs, tables, analysis) in the Croatia energy report