Congo Dr Key Figures
- Population:
- 109 million
- GDP growth rate:
- 6.68 %/year
- Energy independence:
- 95.1%
Data of the last year available: 2024
- Total consumption/GDP:*
- 83.9 (2015=100)
- CO2 Emissions:
- 0.08 tCO2/cap
- Rate of T&D power losses:
- 9.43%
* at purchasing power parity
View all macro and energy indicators in the Congo DR energy report
Congo Dr Energy News
View all news, archive your new and create your own daily newsletters only on your topics/countries of interest with Key Energy Intelligence
Congo Dr Energy Research
- Congo DR's Energy & Climate Policy Framework: Government targets 100% electrification by 2045, prioritising hydro, gas, and renewables under new energy policies.
- Congo DR's Energy Companies: SNEL dominates DRC’s electricity (95% capacity), while Perenco leads oil production. SNEL also handles transmission and distribution. Private firms like Virunga SARL and Sycohydro contribute to generation.
- Congo DR's Energy Supply & Demand: The Democratic Republic of Congo relies heavily on hydroelectricity (94% of capacity) and biomass (90% of energy supply), with rising demand (4%/year) and limited grid infrastructure. Oil is exported; net electricity importer despite vast hydro potential.
- Congo DR's Energy Use & Price by Sector: Biomass dominates energy use (90%), with low electrification (22%). Industry and transport sectors show contrasting trends, while energy prices remain high.
- Congo DR's Issues & Prospects: DRC’s energy sector sees slow progress in hydropower and solar projects, with Grand Inga (40 GW) and solar schemes (2 GW) facing delays due to funding and security concerns.
Benefit from up to 2 000 up-to-date data series for 186 countries in Global Energy & CO2 data
A data overview is available in the global energy statistics app
Congo Dr Total Energy Production & Consumption
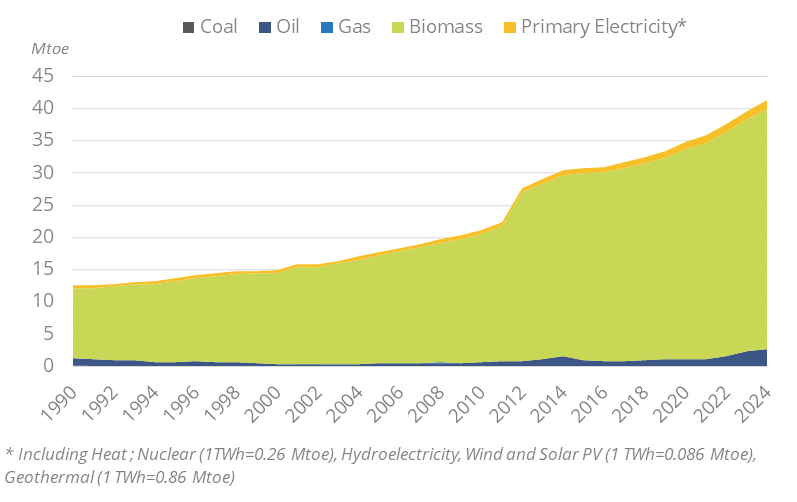
Total energy consumption has been increasing steadily since 2020 at a rate of about 4%/year to 41 Mtoe in 2024, after a period of slower growth between 2013 and 2019 (around 2%/year). Biomass is the main energy source (90%, -3 pp since 2010), followed by oil (7%, +3 pp) and hydro (3%). Energy consumption per capita is 0.38 toe.
Graph: Primary Consumption Trends by Energy Source
Graph: Total Consumption Market Share by Energy (2024)
Source: Congo DR energy report
Interactive Chart Congo Dr Total Energy Production & Consumption
Source: Global Energy & CO2 data
Benefit from up to 2 000 up-to-date data series for 186 countries in Global Energy & CO2 data
View the detailed fondamentals of the market at country level (graphs, tables, analysis) in the Congo DR energy report
Congo Dr Oil Production & Consumption
Oil production declined sharply by nearly 18% in 2024 to 0.84 Mt, following stability in 2023 and another significant drop of 13% in 2022. It was roughly stable between 2008 and 2021 (1.1-1.2 Mt). Before that, it had declined from a peak of 1.4 Mt in 2004.
Since the closure of the SOCIR refinery in 2001, all the crude oil production is exported. Oil product consumption has been very rapid since 2021, reaching 2.7 Mt in 2024 (over 30%/year), after growth of 7%/year over 2010-2019. It is almost entirely consumed in transport.
Graph: Crude Oil Production & Consumption
Source: Congo DR energy report
Interactive Chart Congo Dr Crude Oil Production & Consumption
Source: Global Energy & CO2 data
Interactive Chart Congo Dr Refined Oil Products Production & Consumption
Source: Global Energy & CO2 data
Benefit from up to 2 000 up-to-date data series for 186 countries in Global Energy & CO2 data
Additionally, for more detailed information on refineries, you can request a sample of our EMEA Refineries Dataset
Congo Dr Renewable in % Electricity Production
The country is committed to maintaining the share of renewable energy in the power production mix at 95%, with production expected to double by 2030 and quintuple by 2040.
Source: Congo DR energy report
Interactive Chart Congo Dr Share of Renewables in Electricity Production (incl hydro)
Source: Global Energy & CO2 data
Benefit from up to 2 000 up-to-date data series for 186 countries in Global Energy & CO2 data
Congo Dr GHG emissions and CO2 emissions
In its updated NDC (2021), the country is targeting a 21% reduction in GHG emissions in 2030 compared to a BAU scenario, of which 2% is unconditional and 19% is conditional upon international support. The investment needed to implement the NDC mitigation actions is estimated at US$25.6bn.
Source: Congo DR energy report
Interactive Chart Congo Dr CO2 emissions
Source: Global Energy & CO2 data
Benefit from up to 2 000 up-to-date data series for 186 countries in Global Energy & CO2 data
View the detailed consumption trends at country level (graphs, tables, analysis) in the Congo DR energy report