Congo Dr Key Figures
- Population:
- 102 million
- GDP growth rate:
- 8.56 %/year
- Energy independence:
- 97.0%
Data of the last year available: 2023
- Total consumption/GDP:*
- 77.9 (2005=100)
- CO2 Emissions:
- 0.06 tCO2/capita
- Rate of T&D power losses:
- 14.2%
* at purchasing power parity
View all macro and energy indicators in the Congo DR energy report
Congo Dr Energy News
View all news, archive your new and create your own daily newsletters only on your topics/countries of interest with Key Energy Intelligence
Congo Dr Energy Research
Benefit from up to 2 000 up-to-date data series for 186 countries in Global Energy & CO2 data
A data overview is available in the global energy statistics app
Congo Dr Total Energy Production & Consumption
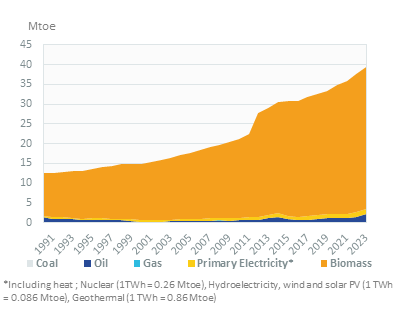
Energy consumption per capita is 0.38 toe, including around 128 kWh of electricity (2023).
Total consumption has increased by 4%/year since 2020.
Biomass covers 92% of the country's energy needs. Although it has a large surplus of firewood, the eastern part of the country, which is more populated, is subject to fast deforestation, just like the periphery of the cities.
Graph: CONSUMPTION TRENDS BY ENERGY SOURCE (Mtoe)
Source: Congo DR energy report
Interactive Chart Congo Dr Total Energy Production & Consumption
Source: Global Energy & CO2 data
Benefit from up to 2 000 up-to-date data series for 186 countries in Global Energy & CO2 data
View the detailed fondamentals of the market at country level (graphs, tables, analysis) in the Congo DR energy report
Congo Dr Oil Production & Consumption
Oil production remained stable in 2023 (1 Mt). It was roughly stable between 2008 and 2021 (1.1-1.2 Mt) and decreased slightly in 2022. It declined between a peak of 1.4 Mt in 2004 and 2008.
Since the closure of the SOCIR refinery in 2001, all the crude oil production is exported.
Source: Congo DR energy report
Interactive Chart Congo Dr Crude Oil Production & Consumption
Source: Global Energy & CO2 data
Interactive Chart Congo Dr Refined Oil Products Production & Consumption
Source: Global Energy & CO2 data
Benefit from up to 2 000 up-to-date data series for 186 countries in Global Energy & CO2 data
Additionally, for more detailed information on refineries, you can request a sample of our EMEA Refineries Dataset
Congo Dr GHG emissions and CO2 emissions
In its updated NDC (2021), the country is targeting a 21% reduction in GHG emissions in 2030 compared to a BAU scenario, of which 2% is unconditional and 19% is conditional upon international support. The investment needed to implement the NDC mitigation actions is estimated at US$25.6bn.GHG emissions including LULUCF increased by a third from 531 MtCO2eq in 2000 to 709 MtCO2eq in 2018. The forest sector is the main GHG emitting sector, accounting for 3/4 of the total, followed by the waste sector (23%).
Source: Congo DR energy report
Interactive Chart Congo Dr CO2 emissions
Source: Global Energy & CO2 data
Benefit from up to 2 000 up-to-date data series for 186 countries in Global Energy & CO2 data
View the detailed consumption trends at country level (graphs, tables, analysis) in the Congo DR energy report