Chile Key Figures
- Population:
- 19.9 million
- GDP growth rate:
- 2.29 %/year
- Energy independence:
- 38.0%
Data of the last year available: 2025
- Total consumption/GDP:*
- 94.0 (2015=100)
- CO2 Emissions:
- 3.91 tCO2/cap
- Rate of T&D power losses:
- 6.36%
* at purchasing power parity
View all macro and energy indicators in the Chile energy report
Chile Energy News
View all news, archive your new and create your own daily newsletters only on your topics/countries of interest with Key Energy Intelligence
Chile Energy Research
- Chile's Energy & Climate Policy Framework: Chile targets 80% renewable power by 2030, a full coal phase-out by 2035, and net-zero emissions by 2050, supported by robust regulatory frameworks, energy efficiency laws, and carbon taxation.
- Chile's Energy Companies: Chile’s energy sector is dominated by private firms in electricity and gas, whilst state-owned ENAP maintains a key role in oil and gas production and refining. Coal is now entirely private.
- Chile's Energy Supply & Demand: Chile is rapidly transitioning its energy sector, with renewables now providing 60% of power generation. While fossil fuel reliance persists, major investments are boosting renewable capacity.
- Chile's Energy Use & Price by Sector: Final energy consumption has reached record levels, driven by industry. While oil remains dominant, electrification is essential to meet climate goals, with fuel prices expected to rise in 2026.
- Chile's Issues & Prospects: Chile is advancing its 2050 carbon-neutral roadmap by expanding renewables, storage, and transmission infrastructure, alongside significant investments in green hydrogen for future export markets.
Benefit from up to 2 000 up-to-date data series for 186 countries in Global Energy & CO2 data
A data overview is available in the global energy statistics app
Chile Total Energy Production & Consumption
Total energy consumption increased by 4% in 2025 to 42 Mtoe, after a 2%/year decrease over 2022-2024. Previously, it progressed by 3.5%/year between 2014 and 2019.
Graph: Primary Consumption Trends by Energy Source
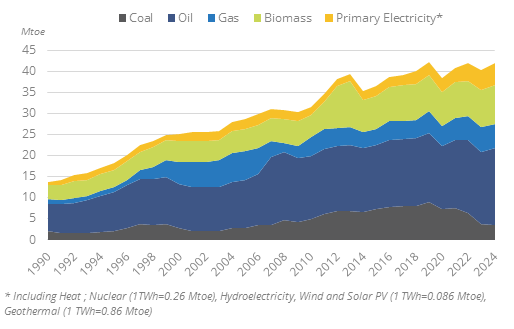
Source: Chile energy report
Interactive Chart Chile Total Energy Production & Consumption
Source: Global Energy & CO2 data
Benefit from up to 2 000 up-to-date data series for 186 countries in Global Energy & CO2 data
View the detailed fondamentals of the market at country level (graphs, tables, analysis) in the Chile energy report
Chile Oil Production & Consumption
Crude oil production is negligible (less than 0.5 Mt in 2025). Imports consisted of 9.3 Mt and covered 85% of the domestic demand in 2025.The country has largely been an importer of crude oil since 1990. Crude oil consumption has increased by 10% in 2025 to reach 11 Mt, similar to its pre-COVID level. Since 2000 it fluctuated between 8.5 Mt and 12.3 Mt (2006).
Petroleum products production has been fluctuating since 2020 but increased again to a peak of 11 Mt in 2025, above pre-COVID level. Previously, it increased between 2010 and 2019 (+1.9%/year) before a 17% drop in 2020.
Source: Chile energy report
Interactive Chart Chile Crude Oil Production & Consumption
Source: Global Energy & CO2 data
Interactive Chart Chile Refined Oil Products Production & Consumption
Source: Global Energy & CO2 data
Benefit from up to 2 000 up-to-date data series for 186 countries in Global Energy & CO2 data
Additionally, for more detailed information on refineries, you can request a sample of our America Refineries Dataset
Chile Natural Gas Production & Consumption
Gas production is low (1.8 bcm in 2025) and is primarily intended for the supply of the Methanex methanol plant in the south of Chile.
Gas imports rose between 2008 and 2022 with the commissioning of two LNG import terminals in 2009 and 2010. Imports grew by 6%/year over 2014-2022 and dropped by 4%/year since then to 5.1 bcm in 2025.
Graph: Gas Production & Consumption
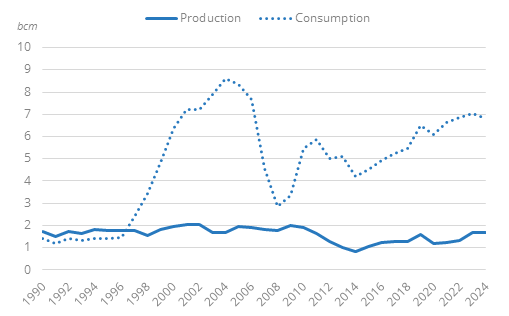
Source: Chile energy report
Interactive Chart Chile Gas Production & Consumption
Source: Global Energy & CO2 data
Benefit from up to 2 000 up-to-date data series for 186 countries in Global Energy & CO2 data
Additionally, for more detailed information on the LNG trade, you can request a sample of our America LNG Trade Dataset
Chile Coal and Lignite Production & Consumption
Coal production has almost ceased since 2021 (0.05 Mt in 2025). Production rose from 0.7 Mt in 2012 to 4.2 Mt in 2014 with the start of the Mina Invierno coal mine.
Coal consumption has halved from 2019 to 2023 and has remained roughly stable since then (6 Mt in 2025), because of the shut-down of 1.3 GW of coal-fired capacity. Previously, coal consumption had increased regularly by 6%/year since 2010, reaching 14 Mt in 2019, with the commissioning of several coal power plants.
Graph: Coal Production & Consumption
Source: Chile energy report
Interactive Chart Chile Coal and Lignite Production & Consumption
Source: Global Energy & CO2 data
Benefit from up to 2 000 up-to-date data series for 186 countries in Global Energy & CO2 data
View the detailed consumption trends at country level (graphs, tables, analysis) in the Chile energy report
Chile Renewable in % Electricity Production
The development of renewables is under the responsibility of the Sustainable Energy Department of the Ministry of Energy.
The 2022 National Energy Policy sets targets of 80% of the electricity mix from renewables in 2030 (60% from non-conventional renewables) and 100% zero emissions in 2050.
The National Heat and Cooling Strategy (2021) targets 80% of "sustainable" energy used for heat and cooling by 2050 (and 45% by 2030). It seeks to enhance the electrification of thermal needs, replacing fossil fuels and firewood, and to tackle fuel poverty.
Source: Chile energy report
Interactive Chart Chile Share of Renewables in Electricity Production (incl hydro)
Source: Global Energy & CO2 data
Benefit from up to 2 000 up-to-date data series for 186 countries in Global Energy & CO2 data
Chile GHG emissions and CO2 emissions
In September 2025, Chile released its updated Nationally Determined Contributions (NDC 3.0), committing to peak its emissions in 2025 and to reach a maximum emission level of 95 MtCO2eq by 2030 (a 23% cut compared to its first NDC and similar to its second). As well, Chile aims to cut energy intensity by 20% by 2035 compared to 2019. In this revised NDC, Chile reaffirmed its target of becoming carbon neutral in 2050, as set in the second NDC and confirmed in the Climate Law (2022). The Environment Ministry is in charge of assessing the progress every 5 years.
Source: Chile energy report
Interactive Chart Chile CO2 emissions
Source: Global Energy & CO2 data
Benefit from up to 2 000 up-to-date data series for 186 countries in Global Energy & CO2 data
View the detailed consumption trends at country level (graphs, tables, analysis) in the Chile energy report