Cameroon Key Figures
- Population:
- 28.4 million
- GDP growth rate:
- 3.25 %/year
- Energy independence:
- 100%
Data of the last year available: 2023
- Total consumption/GDP:*
- 92.8 (2015=100)
- CO2 Emissions:
- 0.27 tCO2/cap
- Rate of T&D power losses:
- 22.5%
* at purchasing power parity
View all macro and energy indicators in the Cameroon energy report
Cameroon Energy News
View all news, archive your new and create your own daily newsletters only on your topics/countries of interest with Key Energy Intelligence
Cameroon Energy Research
- Cameroon's Energy & Climate Policy Framework: Cameroon targets 25% renewables in electricity by 2035 and 35% GHG reduction by 2030. The Ministry of Water and Energy oversees policy, with hydrocarbons crucial for exports. The country aims to double energy production by 2035, focusing on gas and hydropower, while facing financial challenges.
- Cameroon's Energy Companies: Eneo, the primary power generator in Cameroon, faces financial challenges, prompting potential nationalisation. Key oil and gas players include Perenco and Victoria Oil & Gas. The energy sector includes hydro and thermal power, with Eneo supplying major industrial customers. Transmission is managed by Sonatrel, while distribution is handled by Eneo, serving 2.2 million customers. The oil sector involves upstream, midstream, and downstream activities, with Sonara as the main refiner. Gas production is led by Victoria Oil & Gas and Perenco.
- Cameroon's Energy Supply & Demand: Cameroon's energy mix relies heavily on biomass (71%) and hydroelectricity (45% of installed capacity). The 420 MW Nachtigal hydropower plant, commissioned in 2025, is the largest facility. Oil imports dominate since the 2019 refinery fire, while gas production has surged, with LNG exports to Europe and Asia. Electricity generation faces challenges, including aging infrastructure and supply disruptions.
- Cameroon's Energy Use & Price by Sector: "Biomass dominates energy use (74%), with rising fuel prices and subsidy phase-out plans by 2026. Residential, services, and agriculture sectors lead demand growth, while industrial and transport sectors remain stable."
- Cameroon's Issues & Prospects: Cameroon is expanding its energy sector with new refineries, gas, hydro, and solar projects, aiming for 6 GW capacity by 2035. Key initiatives include a Kribi refinery (2027), gas plants, hydropower developments, and transmission upgrades, supported by international funding.
Benefit from up to 2 000 up-to-date data series for 186 countries in Global Energy & CO2 data
A data overview is available in the global energy statistics app
Cameroon Total Energy Production & Consumption
Total energy consumption per capita is 0.4 toe (2023).
Total energy consumption has increased by 3%/year since 2017, reaching 11.5 Mtoe in 2023, after two times faster growth between 2010 and 2015.
Graph: Primary Consumption Trends by Energy Source
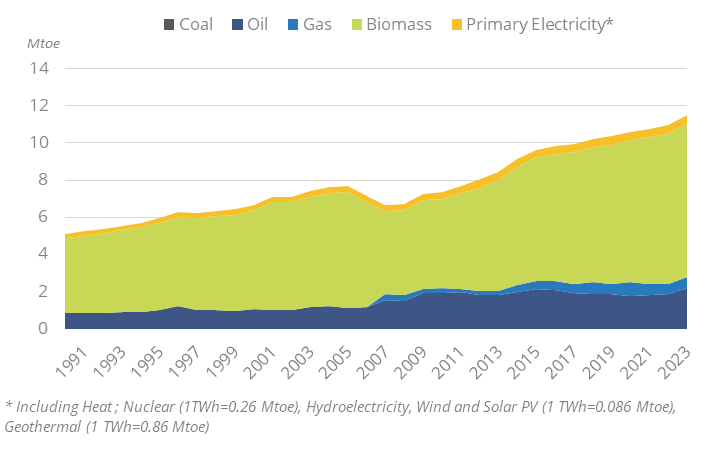
Source: Cameroon energy report
Interactive Chart Cameroon Total Energy Production & Consumption
Source: Global Energy & CO2 data
Benefit from up to 2 000 up-to-date data series for 186 countries in Global Energy & CO2 data
View the detailed fondamentals of the market at country level (graphs, tables, analysis) in the Cameroon energy report
Cameroon Oil Production & Consumption
Graph: Crude Oil Production & Consumption
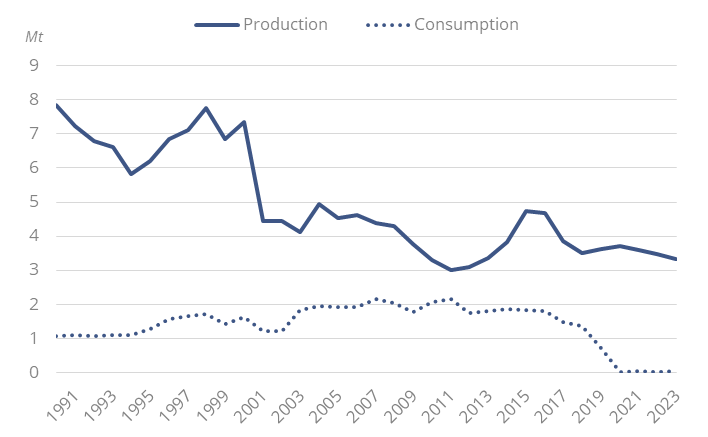
Source: Cameroon energy report
Interactive Chart Cameroon Crude Oil Production & Consumption
Source: Global Energy & CO2 data
Interactive Chart Cameroon Refined Oil Products Production & Consumption
Source: Global Energy & CO2 data
Benefit from up to 2 000 up-to-date data series for 186 countries in Global Energy & CO2 data
Additionally, for more detailed information on refineries, you can request a sample of our EMEA Refineries Dataset
Cameroon Natural Gas Production & Consumption
Gas production has quadrupled since 2017, driven by the launch of LNG production. In 2023, gas production reached 2.5 bcm. Before this surge, gas production had been gradually increasing since 2010, with the start-up of production at the Logbaba field (reserves estimated at 6 bcm of gas and 2.8 Mbl of condensate).
Source: Cameroon energy report
Interactive Chart Cameroon Gas Production & Consumption
Source: Global Energy & CO2 data
Benefit from up to 2 000 up-to-date data series for 186 countries in Global Energy & CO2 data
Additionally, for more detailed information on the LNG trade, you can request a sample of our EMEA LNG Trade Dataset
Cameroon Coal and Lignite Production & Consumption
Cameroon has no domestic coal production.
Graph: Coal Production & Consumption
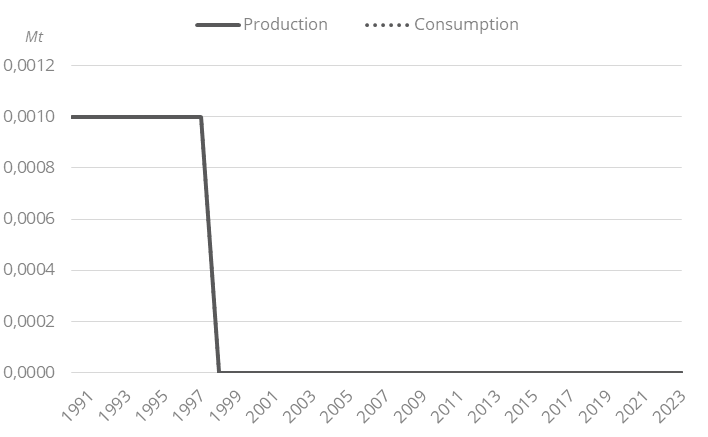
Source: Cameroon energy report
Interactive Chart Cameroon Coal and Lignite Production & Consumption
Source: Global Energy & CO2 data
Benefit from up to 2 000 up-to-date data series for 186 countries in Global Energy & CO2 data
View the detailed consumption trends at country level (graphs, tables, analysis) in the Cameroon energy report
Cameroon Renewable in % Electricity Production
The government aims to bring the share of renewables to 25% of the electricity mix in 2035 in its updated NDC (excluding hydropower plants over 5 MW). According to the electricity sector law of 2011, only hydroelectric installations with a capacity below 5 MW are considered as renewable energy sources Achieving the 25% target relies heavily on the development of mini-hydropower and solar projects. Progress in rural household electrification is closely tied to the expansion of these decentralised energy sources.
Source: Cameroon energy report
Interactive Chart Cameroon Share of Renewables in Electricity Production (incl hydro)
Source: Global Energy & CO2 data
Benefit from up to 2 000 up-to-date data series for 186 countries in Global Energy & CO2 data
Cameroon GHG emissions and CO2 emissions
In its updated NDC (2021), Cameroon set the target of a 35% reduction in GHG emissions (without LULUCF) by 2030 compared to 2010. Agriculture represents more than half of total GHG emissions.
Source: Cameroon energy report
Interactive Chart Cameroon CO2 emissions
Source: Global Energy & CO2 data
Benefit from up to 2 000 up-to-date data series for 186 countries in Global Energy & CO2 data
View the detailed consumption trends at country level (graphs, tables, analysis) in the Cameroon energy report