
- Update
- Format
- 3 files (PDF report, 2 Excel files)
- Pages
-
54 (Report only)
- Delivery
- Immediate by e-mail
- GENERAL OVERVIEW
- ENERGY AND CLIMATE POLICY FRAMEWORK
- ENERGY COMPANIES
- ENERGY SUPPLY AND DEMAND
- ENERGY USE AND PRICE BY SECTOR
- ISSUES AND PROSPECTS
- STATISTICS
- ABBREVIATIONS
- GLOSSARY
Buy Cameroon energy report
Price without VAT. Depending on your status and location, VAT might be applicable. Get in touch with us for more information.
After validation, you will immediately receive 3 files by email (one pdf report and 2 excel files containing the datasets).
Overview
Cameroon’s energy strategy balances ambitious renewable targets with reliance on hydrocarbons, aiming to expand hydropower and gas while reducing emissions. State-led agencies oversee electricity and oil sectors, though financial constraints and ageing infrastructure pose challenges to growth and stability.
Get more details on the table of contents and data files, as well as the list of graphs and tables by browsing the tabs below.
Highlights
- The country targets a 25% share of renewables in the electricity mix in 2035 and a 35% reduction in GHG emissions by 2030 compared to 2010.
- Eneo is the main power generator.
- Perenco and Victoria Oil & Gas are the key players in the country's oil and gas sector.
- The commissioning of the 420 MW Nachtigal hydropower plant was completed in March 2025, establishing it as the largest facility in the country.
- Since a fire incident in 2019 at the country's sole refinery, Cameroon imports all its oil products.
- Biomass covers around 3/4 of final energy consumption.
- Gasoline and diesel prices increased by around 40% from 2022 to 2024, and the government intend to phase out oil products subsidies by 2026.
- Construction of a new refinery was launched in Kribi in July 2025 and is expected to be operational by 2027.
- The Cameroon-Chad interconnection project was officially launched in 2023.
Energy & Climate Policy Framework
The Ministry of Water and Energy (MINEE) oversees the design and implementation of the national energy policy.
Energy Companies
Oil:
SNH (Société Nationale des Hydrocarbures) represents the State in the mixed oil companies Sonara (Société Nationale de Raffinage) and SCDP (Société Camerounaise de Dépôts Pétroliers). It also directly operates the Mvia oil field since 2009. In 1999, SNH created a subsidiary company, Tradex, responsible for the export of crude oil and petroleum products.
Energy Supply & Demand
Oil:
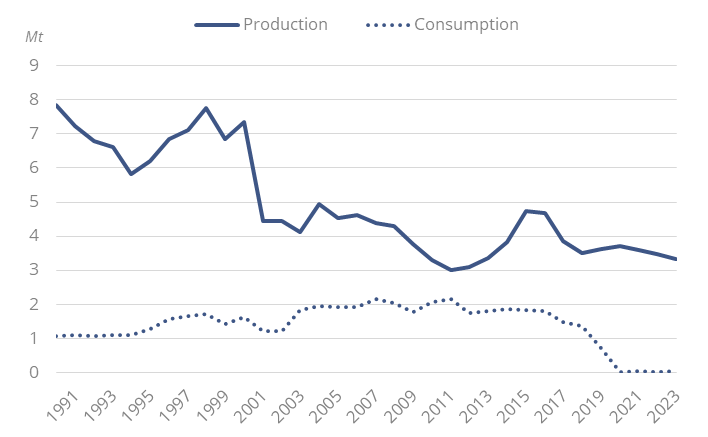
Graph: Crude Oil Production & Consumption
Energy Use and Price by Sector
Energy Prices in Industry:
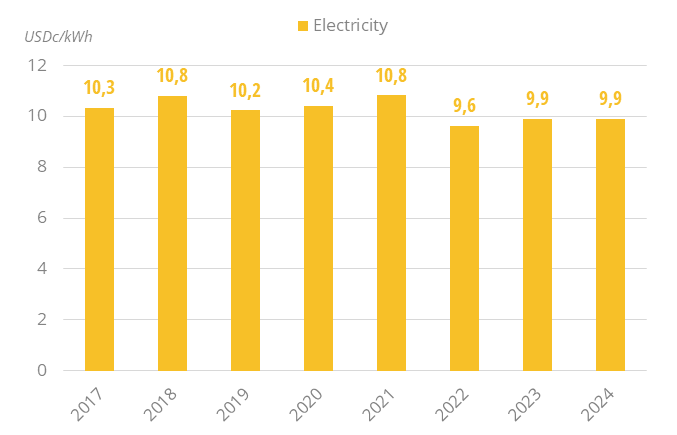
In 2024, the average electricity price for industrial customers remained unchanged, at US$9.9c/kWh, after a slight increase in 2023, and a 10% reduction in 2022.
Graph: Energy Prices in Industry (Taxes Included)
Issues & Prospects
Electricity:
According to the long-term electricity sector development plan (PDSEN-2035), electricity demand is expected to reach between 15 TWh (median growth scenario) and 17 TWh (high growth scenario) in 2035, mainly driven by rapid growth in industry (7-9%/year).
In its NDC, the country planned to reach 6 GW of capacity by 2035 (compared with 1.7 GWin 2022).
- Graph 1: Primary Consumption Trends by Energy Source
- Graph 2: Total Consumption Market Share by Energy (2023)
- Graph 3: Installed Electric Capacity by Source
- Graph 4: Installed Electric Capacity by Source (2023)
- Graph 5: Gross Power Production by Source & Consumption
- Graph 6: Power Generation by Source (2023)
- Graph 7: Crude Oil Production & Consumption
- Graph 8: Petroleum Products Production & Consumption
- Graph 9: Gas Production & Consumption
- Graph 10: Coal Production & Consumption
- Graph 11: GHG Emissions and CO2-energy Emissions
- Graph 12: Final Demand Trends by Energy Source
- Graph 13: Final Consumption by Sector
- Graph 14: Final Consumption Market Share by Sector (2023)
- Graph 15: Final Consumption in Industry by Energy Source
- Graph 16: Energy Prices Including Taxes in Industry
- Graph 17: Final Consumption in Transport by Energy Source
- Graph 18: Energy Prices Including Taxes in Transport
- Graph 19: Final Consumption in Residential, Services, Agriculture by Energy Source
- Graph 20: Energy Prices Including Taxes in Residential
- Graph 21: Upcoming New Capacity by Energy Source
- Economic Indicators: Annual historical data including population, GDP growth, imports and exports, inflation rate, energy security and efficiency indicators, CO2 emissions.
- Supply Indicators: Historical data including oil and gas reserves, electric and refining capacity, energy production, power production and external trade. All are detailed by energy source.
- Demand Indicators: Historical data including consumption per inhabitant, consumption trends, total consumption by energy source, final consumption by energy source and sector, and electricity consumption by sector.
- Energy Balances: Single table displaying the overall energy industry balance per annum, also graphically displayed by energy sub-segment.
The Cameroon energy market data since 1990 and up to
is included in the Excel file accompanying the Cameroon country report.
It showcases the historical evolution, allowing users to easily work with the data.
Key Data included in the excelsheet:
- Economic indicators: Annual historical economic indicators, energy security, energy efficiency and CO2 emissions.
- Supply indicators: Annual historical reserves, capacity, production and external trade (imports(+) exports(-) balance).
- Demand indicators: Annual historical consumption per capita, consumption trends, total consumption, final consumption (per energy and per sector) and electricity consumption total and per sector.
- Energy Balance: total and per energy.
- Cameroon Energy Prices: In addition to the analysis provided on the report we also provided a data set which includes historical details on the Cameroon energy prices for the follow items: price of premium gasoline (taxes incl.), price of diesel (taxes incl.), price of electricity in industry (taxes incl.), price of electricity for households (taxes incl.), price of natural gas in industry (taxes incl.), prices of natural gas for households (taxes incl.), spot price of Brent and CO2 emissions (from fuel combustion).