Brazil Key Figures
- Population:
- 212 million
- GDP growth rate:
- 3.40 %/year
- Energy independence:
- 100%
Data of the last year available: 2024
- Total consumption/GDP:*
- 96.1 (2015=100)
- CO2 Emissions:
- 2.06 tCO2/cap
- Rate of T&D power losses:
- 14.8%
* at purchasing power parity
View all macro and energy indicators in the Brazil energy report
Brazil Energy News
View all news, archive your new and create your own daily newsletters only on your topics/countries of interest with Key Energy Intelligence
Brazil Energy Research
- Brazil's Energy & Climate Policy Framework: Brazil aims for 49% renewables in its energy mix by 2034 and a 63% cut in GHG emissions by 2035. The cap-and-trade carbon market is operational from 2024, with full implementation by 2030. The energy sector is regulated by the Ministry of Mines and Energy, with priorities including energy savings, renewable development, and market competition. The electricity market is liberalising, with 40% of demand now eligible for the free market, targeting full openness by 2028. Oil and gas exploration is shifting to Permanent Offer rounds, with Brazil joining OPEC+ in 2025. Renewables and biofuels are incentivised, with targets for 45–50% renewables by 2030 and rising biofuel blends. The National Hydrogen Program focuses on blue and green hydrogen, supported by EU funding. Energy efficiency programmes like PROCEL and CONPET drive savings, with legal frameworks promoting low-carbon hydrogen and emissions trading.
- Brazil's Energy Companies: Axia Energia leads Brazil's power generation, while Petrobras dominates oil and gas. Key players in distribution include Neoenergia, Enel, and EQTL. Petrobras focuses on upstream investments, particularly in pre-salt areas, and maintains significant refining capacity. Gas distribution is led by Comgás and Naturgy. Biofuel production is dominated by Copersucar, Raizen, and Vibra.
- Brazil's Energy Supply & Demand: Brazil's energy supply rose 3% annually since 2020, with renewables dominating power generation (90% in 2024). Solar capacity surged 50% yearly (2022-2024), led by distributed PV. Biomass (37%) and oil (33%) dominate the energy mix, while hydroelectricity leads electricity generation (56%). Crude oil production increased 64% since 2013, and Brazil is the second-largest biofuel producer globally. Electricity demand grew 5% annually post-2020, with 82% of generation being decarbonised. CO2 emissions from energy use declined 1.4% annually since 2014.
- Brazil's Energy Use & Price by Sector: Since 2020, Brazil's final energy consumption has risen by 4% annually, with biomass and electricity increasingly replacing oil. Industry's share is declining, while transport, residential, and services sectors are growing. Biofuels account for 25% of transport energy, and electricity dominates residential and services consumption.
- Brazil's Issues & Prospects: Brazil aims to triple power demand by 2050, with significant investments in solar, wind, and gas projects. The 10-Year Energy Expansion Plan (PDE 2034) forecasts a 2.1% annual growth in energy consumption, driven by industrial and transport sectors. Renewables will dominate electricity production, with hydropower, solar, and wind leading capacity additions. Nuclear, gas, and biomass projects are also under development, while coal projects have been cancelled. Transmission infrastructure is set to expand by 30,000 km by 2034. Oil and gas sectors are expanding, with Petrobras investing heavily in production and refining. Green hydrogen initiatives are gaining traction, supported by international investments.
Benefit from up to 2 000 up-to-date data series for 186 countries in Global Energy & CO2 data
A data overview is available in the global energy statistics app
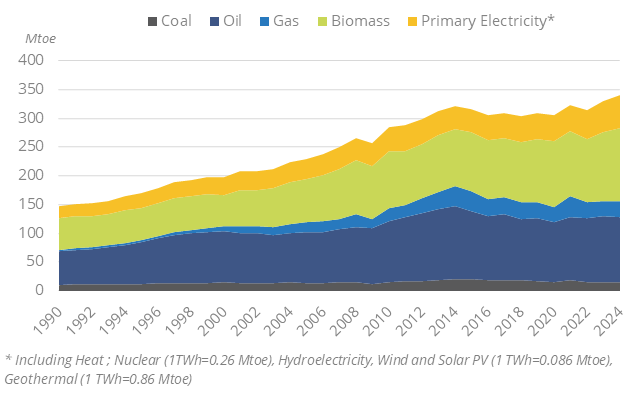
Brazil Total Energy Production & Consumption
Total energy supply has been increasing by around 3%/year since 2020, reaching 340 Mtoe in 2024, after a relative stability between 2015 and 2020. Per capita it reached 1.6 toe in 2024, which is 18% above Latin American countries average and 40% below the EU average.
Graph: Primary Consumption Trends by Energy Source
Source: Brazil energy report
Interactive Chart Brazil Total Energy Production & Consumption
Source: Global Energy & CO2 data
Benefit from up to 2 000 up-to-date data series for 186 countries in Global Energy & CO2 data
View the detailed fondamentals of the market at country level (graphs, tables, analysis) in the Brazil energy report
Brazil Oil Production & Consumption
The country's crude oil production decreased slightly in 2024 to 177 Mt (-1%), but the trend since 2013 is of strong growth (+5%/year until 2023). In 2024, 79% of oil production came from the pre-salt area.
Source: Brazil energy report
Interactive Chart Brazil Crude Oil Production & Consumption
Source: Global Energy & CO2 data
Interactive Chart Brazil Refined Oil Products Production & Consumption
Source: Global Energy & CO2 data
Benefit from up to 2 000 up-to-date data series for 186 countries in Global Energy & CO2 data
Additionally, for more detailed information on refineries, you can request a sample of our America Refineries Dataset
Brazil Natural Gas Production & Consumption
The marketed production of gas decreased by 3% in 2024 to 24 bcm, a level similar to 2022. Previously, it decreased from 2017 to 2020 (-4%/year), after rapid growth between 2009 and 2021 to a peak of 27 bcm (+7%/year). Production supplied 73% of the country's needsin 2024.
The country has around 12 000 km of gas pipelines. It started importing gas from Boliviain 1999 with the commissioning by TBG of the Gasbol gas pipeline between Santa Cruz de la Sierra in Bolivia and Campina in the state of São Paulo (11 bcm/year).
Source: Brazil energy report
Interactive Chart Brazil Gas Production & Consumption
Source: Global Energy & CO2 data
Benefit from up to 2 000 up-to-date data series for 186 countries in Global Energy & CO2 data
Additionally, for more detailed information on the LNG trade, you can request a sample of our America LNG Trade Dataset
Brazil Coal and Lignite Production & Consumption
Coal production decreased by 9% in 2024 to 5.9 Mt. It has been quite stable over time since the 1990s, between 5 and 7 Mt, except in some years it was higher in the 2010s. However, coal consumption is decreasing since its 29 Mt peak in 2015 (excepted in 2021), by around 2%/year, reaching 24 Mt in 2024, leading to the need of coal imports (19 Mt in 2024). Industry accounts for 52% of demand, while the remainder is used to produce electricity.
Graph: Coal Production & Consumption
Source: Brazil energy report
Interactive Chart Brazil Coal and Lignite Production & Consumption
Source: Global Energy & CO2 data
Benefit from up to 2 000 up-to-date data series for 186 countries in Global Energy & CO2 data
View the detailed consumption trends at country level (graphs, tables, analysis) in the Brazil energy report
Brazil Renewable in % Electricity Production
Brazil targets between 45% and 50% of renewables in its energy mix by 2030 according to its roadmap towards carbon neutrality, which corresponds to a stabilization of the share of renewables (around 50% in 2023), despite the increase of energy consumption. In its PDE 2034, Brazil forecasts a 49% share of renewables in the energy mix by 2034.
Since 2009, new contracts for wind, biomass and small hydro plant projects are awarded through competitive bidding.
Source: Brazil energy report
Interactive Chart Brazil Share of Renewables in Electricity Production (incl hydro)
Source: Global Energy & CO2 data
Benefit from up to 2 000 up-to-date data series for 186 countries in Global Energy & CO2 data
Brazil GHG emissions and CO2 emissions
In its second NDC (2024), Brazil set a new target, with a cut of 63% (range 59%-67%) in GHG emissions by 2035 compared to 2005 levels, i.e. reaching GHG emissions between 0.85 and 1.05 GtCO2eq. The objective is to reach carbon neutrality by 2050.
Source: Brazil energy report
Interactive Chart Brazil CO2 emissions
Source: Global Energy & CO2 data
Benefit from up to 2 000 up-to-date data series for 186 countries in Global Energy & CO2 data
View the detailed consumption trends at country level (graphs, tables, analysis) in the Brazil energy report