Bolivia Key Figures
- Population:
- 12.4 million
- GDP growth rate:
- 1.30 %/year
- Energy independence:
- 100%
Data of the last year available: 2024
- Total consumption/GDP:*
- 98.0 (2005=100)
- CO2 Emissions:
- 1.83 tCO2/capita
- Rate of T&D power losses:
- 9.53%
* at purchasing power parity
View all macro and energy indicators in the Bolivia energy report
Bolivia Energy News
View all news, archive your new and create your own daily newsletters only on your topics/countries of interest with Key Energy Intelligence
Bolivia Energy Research
Benefit from up to 2 000 up-to-date data series for 186 countries in Global Energy & CO2 data
A data overview is available in the global energy statistics app
Bolivia Total Energy Production & Consumption
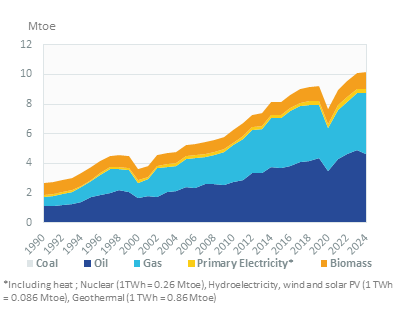
Per capita energy consumption stood at 0.82 toe in 2024 (including 846 kWh of electricity), 26% below the Latin America average (65% below for electricity).
Total energy consumption has increased rapidly since 2020 (7%/year), reaching 10.1 Mtoe in 20242. It grew rapidly between 2010 and 2019 (4%/year).
Graph: CONSUMPTION TRENDS BY ENERGY SOURCE (Mtoe)
Graph: TOTAL CONSUMPTION MARKET SHARE BY ENERGY (2024, %)
Source: Bolivia energy report
Interactive Chart Bolivia Total Energy Production & Consumption
Source: Global Energy & CO2 data
Benefit from up to 2 000 up-to-date data series for 186 countries in Global Energy & CO2 data
View the detailed fondamentals of the market at country level (graphs, tables, analysis) in the Bolivia energy report
Bolivia Oil Production & Consumption
The production of liquid hydrocarbons (crude oil and condensate) has been decreasing since 2014 (-6%/year), reaching 2 Mt in 2024. Previously, it had grown at around 10% per year between 2010 and 2014 and peaked at 3.4 Mt in 2014. There are no crude oil exports.
Source: Bolivia energy report
Interactive Chart Bolivia Crude Oil Production & Consumption
Source: Global Energy & CO2 data
Interactive Chart Bolivia Refined Oil Products Production & Consumption
Source: Global Energy & CO2 data
Benefit from up to 2 000 up-to-date data series for 186 countries in Global Energy & CO2 data
Additionally, for more detailed information on refineries, you can request a sample of our America Refineries Dataset
Bolivia Natural Gas Production & Consumption
The production of natural gas has been on a consistent decline of around 6% per year since 2014, reaching 11.6 bcm in 2024. It grew rapidly between 2000 and 2014, increasing from 3.3 bcm to 22.4 bcm.
Gas exports have been decreasing by around 10% per year since a peak at 18 bcm in 2014, following the decline in gas production, reaching 6.6 bcm in 2024. They were split between Brazil (72%) and Argentina (28%).
Source: Bolivia energy report
Interactive Chart Bolivia Gas Production & Consumption
Source: Global Energy & CO2 data
Benefit from up to 2 000 up-to-date data series for 186 countries in Global Energy & CO2 data
Additionally, for more detailed information on the LNG trade, you can request a sample of our America LNG Trade Dataset
Bolivia Renewable in % Electricity Production
The Electricity Sector Expansion Plan (March 2025) plans to add 5.29 GW of new renewable capacity by 2050 (2.9 GW of hydro, 1.1 GW of wind, 1.1 GW of solar, 100 MW of geothermal). It aims to raise the share of renewable power generation to 75% by 2050 (intermediate target of 65% by 2031). In 2023, renewables covered 29% of the power mix.
In its second NDC (2022), Bolivia has pledged to increase the share of renewables (including large hydro) in energy consumption to 19%.
Source: Bolivia energy report
Interactive Chart Bolivia Share of Renewables in Electricity Production (incl hydro)
Source: Global Energy & CO2 data
Benefit from up to 2 000 up-to-date data series for 186 countries in Global Energy & CO2 data
Bolivia GHG emissions and CO2 emissions
Though not providing any GHG emission cut target by 2030, Bolivia's second NDC includes an 80% reduction in deforestation in 2030 compared to 2020 and the eradication of illegal deforestation. Those objectives depend on the level of international cooperation and financial support to Bolivia.
CO2 emissions from energy combustion dipped by 1% in 2024 to 23 Mt, which is over 4 times higher than 1990 levels. They grew by 11%/year from 2020 to 2023 and by 6%/year from 2000 to 2019, before a sharp 16% drop in 2020.
Graph: CO2-ENERGY EMISSIONS (MtCO2)
Source: Bolivia energy report
Interactive Chart Bolivia CO2 emissions
Source: Global Energy & CO2 data
Benefit from up to 2 000 up-to-date data series for 186 countries in Global Energy & CO2 data
View the detailed consumption trends at country level (graphs, tables, analysis) in the Bolivia energy report