Austria Key Figures
- Population:
- 9.18 million
- GDP growth rate:
- -1.2 %/year
- Energy independence:
- 44.8%
Data of the last year available: 2024
- Total consumption/GDP:*
- 84.4 (2015=100)
- CO2 Emissions:
- 5.45 tCO2/cap
- Rate of T&D power losses:
- 4.60%
* at purchasing power parity
View all macro and energy indicators in the Austria energy report
Austria Energy News
View all news, archive your new and create your own daily newsletters only on your topics/countries of interest with Key Energy Intelligence
Austria Energy Research
- Austria's Energy & Climate Policy Framework: Austria targets 100% renewable electricity by 2030 and carbon neutrality by 2040, with policies supporting energy efficiency, renewables, and climate protection. Recent reforms include a new electricity market law and expanded gas market integration.
- Austria's Energy Companies: OMV leads Austria's oil and gas sector, while Verbund dominates power generation. Key players include Wien Energie and EVN. Public institutions control most energy firms.
- Austria's Energy Supply & Demand: In 2024, Austria's energy mix saw renewables dominate at 87%, while gas imports fell 25%, with Russia supplying 85%. Total energy consumption rebounded slightly to 30.5 bcm, with oil under 34% and biomass at 23%. Electricity generation rose 10% to 82 TWh, with renewables at 87%, including 60% hydro. CO2 intensity halved since 2010, reaching 106 gCO₂/kWh. Austria became a net electricity exporter, with significant interconnections to neighbouring countries. Gas consumption hit a historic low, and GHG emissions decreased by 2% to 67 MtCO2e.
- Austria's Energy Use & Price by Sector: In 2024, Austria's final energy demand rebounded to 25 Mtoe, with oil as the primary source. Electricity prices were capped for households, and subsidies were introduced for industries. The share of electricity in final energy consumption remained stable at 21%, with projections for significant electrification by 2050. Industry and transport saw varied energy price trends, while residential, services, and agriculture experienced a decline in consumption. Government measures, including price brakes and subsidies, aimed to mitigate rising energy costs.
- Austria's Issues & Prospects: Austria is expanding its renewable energy capacity, focusing on hydropower, solar, and wind, while reinforcing gas interconnections and developing a hydrogen-compatible network to become a transit hub. The country aims for 100% renewable electricity by 2030, with significant investments in infrastructure and projects under development.
Benefit from up to 2 000 up-to-date data series for 186 countries in Global Energy & CO2 data
A data overview is available in the global energy statistics app
Austria Total Energy Production & Consumption
In 2024, total energy consumption rebounded slightly (+0.9%) to 30.5 bcm after a 5%/year decrease over 2021-2023 due to warmer weather (-3.9%/year at normal climate), lower industrial production, and high prices. It remained relatively stable over 2010-2019 at normal climate, followed by 5.5% growth in 2021 due to the economic recovery after the Covid-19 outbreak. Per capita consumption is, with 3.3 toe, 20% higher than the EU average in 2024.
Source: Austria energy report
Interactive Chart Austria Total Energy Production & Consumption
Source: Global Energy & CO2 data
Benefit from up to 2 000 up-to-date data series for 186 countries in Global Energy & CO2 data
View the detailed fondamentals of the market at country level (graphs, tables, analysis) in the Austria energy report
Austria Oil Production & Consumption
Oil production is low and stable (around 0.5 Mt); it covers around 5% of the country's needs. In 2024, Austria imported 7.5 Mt of crude oil, mainly from Kazakhstan (56%, +18 pp), Libya (14%, -10 pp), and Saudi Arabia (12%), principally by pipeline from Trieste to the Schwechat refinery. Imports from Russia were cut from 8% in 2021 to nearly 0% in 2023.
Austria has large oil storage capacities, for the equivalent of 108 days of net imports (as of December 2024).
Source: Austria energy report
Interactive Chart Austria Crude Oil Production & Consumption
Source: Global Energy & CO2 data
Interactive Chart Austria Refined Oil Products Production & Consumption
Source: Global Energy & CO2 data
Benefit from up to 2 000 up-to-date data series for 186 countries in Global Energy & CO2 data
Additionally, for more detailed information on refineries, you can request a sample of our EMEA Refineries Dataset
Austria Natural Gas Production & Consumption
Gas production has been decreasing by more than 9%/year since 2013, when it peaked at 1.8 bcm, falling below 0.6 bcm in 2024 (8% of total consumption).
Gas imports decreased by 25% to 5.4 bcm in 2024. Russia remained the country's main supplier with a 85% share in gas imports in 2024, although with a decrease since 2021 (96%), followed by Germany (14%). Austria exports nearly 55% of the natural gas it physically imports, mainly to Italy. The gas flow mainly takes place through the Central European Gas Hub (CEGH) in Baumgarten.
Source: Austria energy report
Interactive Chart Austria Gas Production & Consumption
Source: Global Energy & CO2 data
Benefit from up to 2 000 up-to-date data series for 186 countries in Global Energy & CO2 data
Additionally, for more detailed information on the LNG trade, you can request a sample of our EMEA LNG Trade Dataset
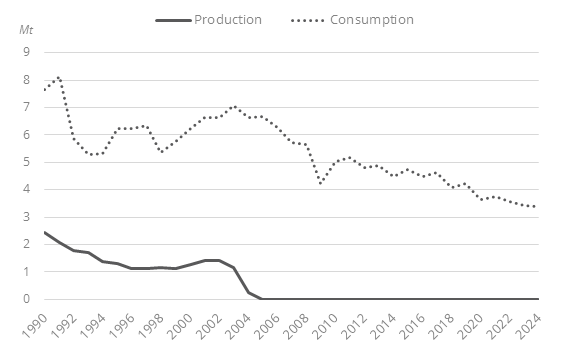
Austria Coal and Lignite Production & Consumption
All the coal consumed is imported. Coal consumption halved between 2004 and 2024 to below 3.4 Mt (-1%), corresponding to an average decrease of 4%/year over 2019-2024 and of 2%/year over 2010-2019.
Two-thirds of coal is consumed by energy industries (power plants, coke ovens).
Graph: Coal Production & Consumption
Source: Austria energy report
Interactive Chart Austria Coal and Lignite Production & Consumption
Source: Global Energy & CO2 data
Benefit from up to 2 000 up-to-date data series for 186 countries in Global Energy & CO2 data
View the detailed consumption trends at country level (graphs, tables, analysis) in the Austria energy report
Austria Renewable in % Electricity Production
According to the final NECP 2024, the objective is to raise the share of renewables in gross final energy consumption to 57% in 2030 (up from 46-50%, previously). In 2024, this share reached 43%, of which 100% for electricity (90% in 2024) and 14% for transport (14.6%in 2024). For 2020, the national target of a 34% share of renewables in final energy consumption has been exceeded by 2.5 points.
Source: Austria energy report
Interactive Chart Austria Share of Renewables in Electricity Production (incl hydro)
Source: Global Energy & CO2 data
Benefit from up to 2 000 up-to-date data series for 186 countries in Global Energy & CO2 data
Learn more about renewables in the European Battery Market Analysis
Austria GHG emissions and CO2 emissions
As part of its final NECP 2024, the country aims at reducing non-ETS emissions by 48%in 2030 compared to 2005. The final NECP 2024 also mentions a targeted 880 ktCO2 increase in net carbon storage by 2030 compared to the 2016-2018 base period. The government announced in 2020 its objective of achieving carbon neutrality by 2040.
Source: Austria energy report
Interactive Chart Austria CO2 emissions
Source: Global Energy & CO2 data
Benefit from up to 2 000 up-to-date data series for 186 countries in Global Energy & CO2 data
View the detailed consumption trends at country level (graphs, tables, analysis) in the Austria energy report