Angola Key Figures
- Population:
- 37.9 million
- GDP growth rate:
- 4.42 %/year
- Energy independence:
- 100%
Data of the last year available: 2024
- Total consumption/GDP:*
- 111 (2015=100)
- CO2 Emissions:
- 0.46 tCO2/cap
- Rate of T&D power losses:
- 11.6%
* at purchasing power parity
View all macro and energy indicators in the Angola energy report
Angola Energy News
View all news, archive your new and create your own daily newsletters only on your topics/countries of interest with Key Energy Intelligence
Angola Energy Research
- Angola's Energy & Climate Policy Framework: Angola's oil sector contributes 30% of GDP, with plans to cut GHG emissions by 5% by 2035. The government is reforming energy policies, opening electricity to private firms, and aiming for 95% renewable energy in new capacity by 2050.
- Angola's Energy Companies: TotalEnergies and Chevron lead Angola's oil sector, while PRODEL dominates electricity generation. RNT manages transmission, and ENDE oversees distribution. Chevron is the top gas producer, with Azule Energy and TotalEnergies also significant. Angola LNG operates the LNG plant, and Shell has recently returned for exploration.
- Angola's Energy Supply & Demand: Angola, Africa's third-largest oil producer, has stabilised electricity production at 16.7 TWh, with hydropower dominating (80%). Gas flaring has significantly reduced to 18% in 2024. Primary energy consumption remains steady at 14 Mtoe, with biomass (52%) and oil (35%) as main sources. The country boasts substantial gas reserves (55 bcm) and oil reserves (347 Mt), alongside a strong hydroelectric potential (65 TWh/year). Electricity consumption grew to 14.4 TWh in 2024, driven by households (70%) and industry (30%). Oil production fluctuates around 57-58 Mt, with exports stable at 54 Mt, primarily to Asia. Gas production stabilised at 6 bcm, with 85% exported as LNG. GHG emissions slightly increased to 64 MtCO₂eq, with deforestation contributing significantly to net emissions.
- Angola's Energy Use & Price by Sector: Buildings account for 60% of energy use. Final demand grew 1.5%/year since 2015, with biomass (46.5%) and oil (40%) dominant. Transport demand surged 6%/year post-2019, while industrial demand fell 7%/year. Electricity prices rose 82% post-2019 subsidy cuts.
- Angola's Issues & Prospects: Angola aims to double its electricity capacity to 10 GW by 2025, with 60% from hydropower, and triple refining capacity by 2026. Investments in energy and water infrastructure are planned, though some targets remain unmet. New projects include hydropower, solar, and gas initiatives, with international partnerships supporting development. Oil and gas exploration continues, with new discoveries and refinery expansions underway. Additionally, Angola is exploring green hydrogen production.
Benefit from up to 2 000 up-to-date data series for 186 countries in Global Energy & CO2 data
A data overview is available in the global energy statistics app
Angola Total Energy Production & Consumption
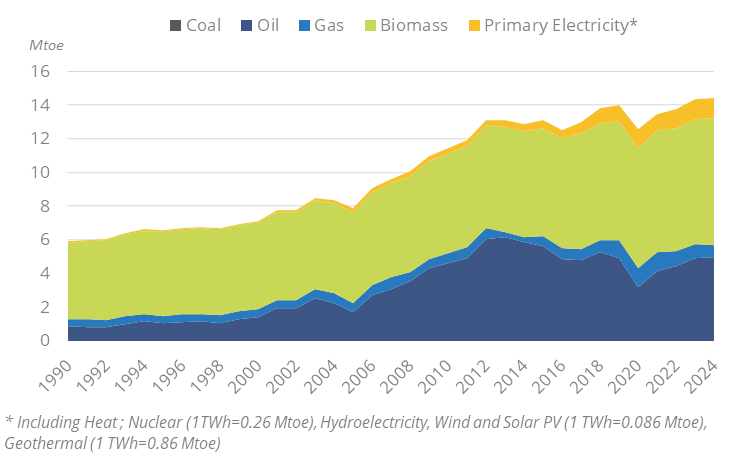
Total primary energy consumption has remained roughly stable at its 2019 level since 2021 (around 14 Mtoe), after a growth by around 2%/year since 2010. Per capita energy consumption is around 0.38 toe. In 2024, biomass (52%) and oil (35%) were the two main sources of primary energy mix.
Graph: Primary Consumption Trends by Energy Source
Graph: Total Consumption Market Share by Energy (2024)
Source: Angola energy report
Interactive Chart Angola Total Energy Production & Consumption
Source: Global Energy & CO2 data
Benefit from up to 2 000 up-to-date data series for 186 countries in Global Energy & CO2 data
View the detailed fondamentals of the market at country level (graphs, tables, analysis) in the Angola energy report
Angola Oil Production & Consumption
Oil production has been fluctuating around 57-58 Mt since 2021, after a 38% decrease between 2015 and 2021. It increased very rapidly from 2000 to its peak level of 96 Mt in 2008 (multiplied by a factor of 2.6) and fluctuated around 80-90 Mt until 2015.
Offshore blocks are divided into three bands: shallow water blocks 0-13 (band A), deepwater blocks 14-30 (band B), and ultra-Deepwater blocks 31-40 (band C). Around 66% of total oil production comes from deep water projects, 15% from ultra-deep water, and 17% from shallow waters.
Source: Angola energy report
Interactive Chart Angola Crude Oil Production & Consumption
Source: Global Energy & CO2 data
Interactive Chart Angola Refined Oil Products Production & Consumption
Source: Global Energy & CO2 data
Benefit from up to 2 000 up-to-date data series for 186 countries in Global Energy & CO2 data
Additionally, for more detailed information on refineries, you can request a sample of our EMEA Refineries Dataset
Angola Natural Gas Production & Consumption
After a rapid), The marketed gas production remained stable in 2024 (6 bcm), after a 9% growth in 2023 and a decrease by almost 30% from 2020 to 2022. It rose 7-fold between 2015 and 2017 (from 0.8 to 5.8 bcm) with the commissioning of the LNG plant and grew by 9%/year progression between 2017 and 2020.
Until 2016, only a small fraction of the gas produced was marketed (less than 10% before 2016 compared to 51% in 2024). The Government has developed policies to limit gas flaring: the share of gas flared has dropped from 70% in 2016 to 18% in 2024.
Source: Angola energy report
Interactive Chart Angola Gas Production & Consumption
Source: Global Energy & CO2 data
Benefit from up to 2 000 up-to-date data series for 186 countries in Global Energy & CO2 data
Additionally, for more detailed information on the LNG trade, you can request a sample of our EMEA LNG Trade Dataset
Angola Renewable in % Electricity Production
The "Angola 2050" strategy (2024) set a target for 95% of new installed capacity to come from renewable sources.
The new National Development Plan (PND) 2023-2027 seems less ambitious than the previous one and does not specify overall targets. It just set targets for the construction and renovation of solar and hydroelectric power plants. The target of PND 2018-2022 to add 500 MW of renewables (of which 200 MW solar, 100 MW wind, 100 MW biomass, and 100 MW mini-hydro) by 2022 was not achieved (290 MW end of 2022 and 360 MW end of 2024, mostly solar).
Source: Angola energy report
Interactive Chart Angola Share of Renewables in Electricity Production (incl hydro)
Source: Global Energy & CO2 data
Benefit from up to 2 000 up-to-date data series for 186 countries in Global Energy & CO2 data
Angola GHG emissions and CO2 emissions
In its updated NDC (2025), Angola set a target to reduce its GHG emissions by up to 5% in 2035 as compared to a 2020 BAU scenario. This GHG emission reduction target could be raised to 11% by 2035 (conditional contribution), corresponding to an estimated mitigation level of 49 MtCO2eq, based on the provision of international support and funding.
Source: Angola energy report
Interactive Chart Angola CO2 emissions
Source: Global Energy & CO2 data
Benefit from up to 2 000 up-to-date data series for 186 countries in Global Energy & CO2 data
View the detailed consumption trends at country level (graphs, tables, analysis) in the Angola energy report