Algeria Key Figures
- Population:
- 46.8 million
- GDP growth rate:
- 3.30 %/year
- Energy independence:
- 100%
Data of the last year available: 2024
- Total consumption/GDP:*
- 94.2 (2015=100)
- CO2 Emissions:
- 3.20 tCO2/cap
- Rate of T&D power losses:
- 10.6%
* at purchasing power parity
View all macro and energy indicators in the Algeria energy report
Algeria Energy News
View all news, archive your new and create your own daily newsletters only on your topics/countries of interest with Key Energy Intelligence
Algeria Energy Research
- Algeria's Energy & Climate Policy Framework: Algeria aims to reduce hydrocarbon dependence by 2030, targeting 16 GW of renewables and diversifying exports. Recent reforms include splitting the energy ministry and introducing new regulations to attract investment in renewables and hydrocarbons. Despite progress, achieving renewable targets remains challenging.
- Algeria's Energy Companies: Algeria's energy sector is dominated by state-owned Sonatrach (oil & gas) and Sonelgaz (electricity & gas distribution). Sonelgaz recently expanded its power sector control through acquisitions, while Sonatrach remains Africa's largest oil and gas company, with significant foreign partnerships. Both firms oversee extensive transmission and distribution networks.
- Algeria's Energy Supply & Demand: Algeria's energy sector is dominated by gas, which accounts for 70% of primary consumption, with significant exports. Electricity generation is nearly entirely gas-based, while oil consumption remains stable. Natural gas production has risen, with exports to Europe comprising a substantial portion. The country also has vast shale gas reserves. Energy demand has decreased slightly, but per capita consumption remains high due to the oil and gas sector.
- Algeria's Energy Use & Price by Sector: Final energy demand rose 4%/year since 2010, with gas leading consumption. Prices are regulated, stable since 2016. Households and services now account for 37% of demand.
- Algeria's Issues & Prospects: Algeria is expanding its energy sector with nuclear, gas, solar, and wind projects to meet rising demand and attract investors. It aims to boost electricity production, develop transmission networks, and enhance oil and gas output, while exploring green hydrogen exports to Europe.
Benefit from up to 2 000 up-to-date data series for 186 countries in Global Energy & CO2 data
A data overview is available in the global energy statistics app
Algeria Total Energy Production & Consumption
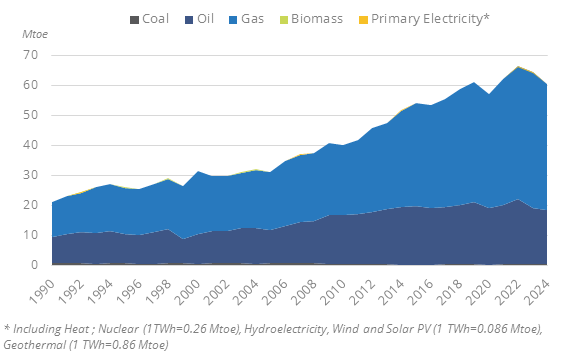
Total primary consumption decreased for the second year in a row to 60 Mtoe in 2024(-4.5%/year since 2022), contrasting with its rapid growth over 2005-2022 (+4.5%/year). Per capita consumption is high (1.3 toe), partly because of the oil and gas sector.
Energy consumption is mostly covered by gas (70% in 2024, +11 pp since 2010) and oil (30%, -10 pp).
Graph: Primary Consumption Trends by Energy Source
Source: Algeria energy report
Interactive Chart Algeria Total Energy Production & Consumption
Source: Global Energy & CO2 data
Benefit from up to 2 000 up-to-date data series for 186 countries in Global Energy & CO2 data
View the detailed fondamentals of the market at country level (graphs, tables, analysis) in the Algeria energy report
Algeria Oil Production & Consumption
Primary consumption by oil has been stable at around 19 Mtoe since 2013 (18.1 Mtoein 2024). Since 2010, it has increased by 1%/year.
Algeria is part of the OPEC and subject to crude oil production quotas; it is also taking part in voluntary production adjustments under the OPEC+ group.
Oil production (crude oil and NGL) decreased for the second year in a row in 2024 (-7%) to 56 Mt; it fell by 11% in 2020 and rebounded by 1% in 2021 and 6% in 2022. Overall, crude oil production has been eroding by 3%/year since its 2005 peak (100 Mt).
Source: Algeria energy report
Interactive Chart Algeria Crude Oil Production & Consumption
Source: Global Energy & CO2 data
Interactive Chart Algeria Refined Oil Products Production & Consumption
Source: Global Energy & CO2 data
Benefit from up to 2 000 up-to-date data series for 186 countries in Global Energy & CO2 data
Additionally, for more detailed information on refineries, you can request a sample of our EMEA Refineries Dataset
Algeria Natural Gas Production & Consumption
Gas consumption dropped by 7% in 2024 to 42 Mtoe. Between 2002 and 2019, it increased regularly 7%/year. From 2010 to 2019, it increased by 6%/year.
Natural gas production decreased by 6% in 2024 to 103 bcm, after a 4% increase in 2023.
Source: Algeria energy report
Interactive Chart Algeria Gas Production & Consumption
Source: Global Energy & CO2 data
Benefit from up to 2 000 up-to-date data series for 186 countries in Global Energy & CO2 data
Additionally, for more detailed information on the LNG trade, you can request a sample of our EMEA LNG Trade Dataset
Algeria Coal and Lignite Production & Consumption
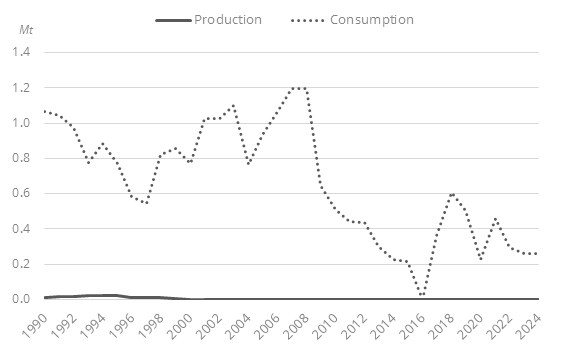
Coal production stopped in 2000. Consumption is around 0.3 Mt since 2021.
Graph: Coal Production & Consumption
Source: Algeria energy report
Interactive Chart Algeria Coal and Lignite Production & Consumption
Source: Global Energy & CO2 data
Benefit from up to 2 000 up-to-date data series for 186 countries in Global Energy & CO2 data
View the detailed consumption trends at country level (graphs, tables, analysis) in the Algeria energy report
Algeria Renewable in % Electricity Production
The Renewable Energies and Energy Efficiency Commission (CEREFE), created in 2019, contributes to the national development of renewables and energy efficiency as an adviser and evaluates the national policy.
A Law on the promotion of renewable energies in the context of sustainable development was adopted in 2004.
Source: Algeria energy report
Interactive Chart Algeria Share of Renewables in Electricity Production (incl hydro)
Source: Global Energy & CO2 data
Benefit from up to 2 000 up-to-date data series for 186 countries in Global Energy & CO2 data
Algeria GHG emissions and CO2 emissions
In its NDC (2015), the country announced its aim to reduce GHG emissions by 7% by 2030 compared to a BAU scenario, which could be raised to 22% under the condition of access to new financial resources from bilateral and multilateral partners, as well as clean technology transfer on concessional and preferential terms.
Source: Algeria energy report
Interactive Chart Algeria CO2 emissions
Source: Global Energy & CO2 data
Benefit from up to 2 000 up-to-date data series for 186 countries in Global Energy & CO2 data
View the detailed consumption trends at country level (graphs, tables, analysis) in the Algeria energy report