Norway Key Figures
- Population:
- 5.57 million
- GDP growth rate:
- 2.10 %/year
- Energy independence:
- 100%
Data of the last year available: 2024
- Total consumption/GDP:*
- 92.0 (2015=100)
- CO2 Emissions:
- 5.95 tCO2/cap
- Rate of T&D power losses:
- 5.31%
* at purchasing power parity
View all macro and energy indicators in the Norway energy report
Norway Energy News
View all news, archive your new and create your own daily newsletters only on your topics/countries of interest with Key Energy Intelligence
Norway Energy Research
- Norway's Energy & Climate Policy Framework: Norway aims for 70-75% GHG reduction by 2035 and carbon neutrality by 2050, with energy policy managed by key ministries and state-owned firms. The country focuses on offshore wind, hydrogen, and energy efficiency, while maintaining significant oil and gas exports. It participates in the EU ETS and has one of the world's highest carbon taxes.
- Norway's Energy Companies: State-owned firms dominate Norway's energy sector, with Statkraft leading power generation (29%) and Equinor hydrocarbons (70%). Statnett manages 98% of the transmission grid, while 92 DSOs handle distribution. Equinor also dominates oil and gas, with Petoro and Aker BP as key players. The retail fuel market is led by Circle K, Uno-X, and YX Norge.
- Norway's Energy Supply & Demand: Norway's energy mix is dominated by hydroelectricity (89% of power production), with wind capacity tripling since 2018. Gas production rose by 8% in 2024, making Norway the 4th largest gas exporter globally. Primary energy consumption has slightly declined since 2019, with electricity accounting for 45% of total energy use. The country's CO2 intensity for electricity generation is very low (6 gCO2/kWh in 2024) and is projected to reach zero by 2030.
- Norway's Energy Use & Price by Sector: Norway's final energy consumption remains stable at 21 Mtoe annually, with high per capita use, driven by electricity. Prices vary by sector, with motor fuels among Europe's highest.
- Norway's Issues & Prospects: Norway plans to boost energy production, with significant investments in offshore wind, hydropower, and nuclear projects. Electricity demand is projected to rise by 57% by 2050, driven by renewable sources. Oil production is also set to increase, alongside advancements in CCS and green hydrogen initiatives.
Benefit from up to 2 000 up-to-date data series for 186 countries in Global Energy & CO2 data
A data overview is available in the global energy statistics app
Norway Total Energy Production & Consumption
Primary energy consumption has fluctuated between 25 and 32 Mtoe since 2000. Since 2019, it has been on a slight declining trend (-1.3%/year). At 4.76 toe per capita, Norway's energy consumption is 85% above the average for European countries (2024).
Primary electricity represented 45% of total energy consumption in 2024 (+10 pp since 2010), of which 40% is hydro; it is followed by oil (25%, -13 pp) and gas (18%, -2 pp), biomass (9%, +3 pp) and coal (3%, stable).
Graph: Primary Consumption Trends by Energy Source
Source: Norway energy report
Interactive Chart Norway Total Energy Production & Consumption
Source: Global Energy & CO2 data
Benefit from up to 2 000 up-to-date data series for 186 countries in Global Energy & CO2 data
View the detailed fondamentals of the market at country level (graphs, tables, analysis) in the Norway energy report
Norway Oil Production & Consumption
Oil and NGL production has increased by 21% since 2019 (+18% in 2020 with the start of operations at the Johan Sverdrup field in 2019). Between 2016 and 2019, production declined by 12%. Production reached a peak of 161 Mt in 2001. Over the last 50 years, about half of the estimated total recoverable resources on the continental shelf have been produced. At the end of 2024, 94 fields were in production: 69 in the North Sea, 23 in the Norwegian Sea and 2 in the Barents Sea.
Source: Norway energy report
Interactive Chart Norway Crude Oil Production & Consumption
Source: Global Energy & CO2 data
Interactive Chart Norway Refined Oil Products Production & Consumption
Source: Global Energy & CO2 data
Benefit from up to 2 000 up-to-date data series for 186 countries in Global Energy & CO2 data
Additionally, for more detailed information on refineries, you can request a sample of our EMEA Refineries Dataset
Norway Natural Gas Production & Consumption
In 2024, gas production increased by 8% to 131 bcm, after a 5% drop % in 2023 and an 8% hike in 2022. Previously, gas production nearly doubled between 1990 (28 bcm) and 2000 (53 bcm) and doubled again until 2010 (110 bcm). Since then, it has increased by around 1.2%/year. Gas production in 2024 was 19% above its 2010 level.
The country's largest gas field is Troll, with 34% of total production in 2024 (44 bcm), and remaining reserves of 564 bcm. In June 2025, Ormen Lange phase III, operated by Shell, started production, raising gas extraction by up to 40 bcm.
Source: Norway energy report
Interactive Chart Norway Gas Production & Consumption
Source: Global Energy & CO2 data
Benefit from up to 2 000 up-to-date data series for 186 countries in Global Energy & CO2 data
Additionally, for more detailed information on the LNG trade, you can request a sample of our EMEA LNG Trade Dataset
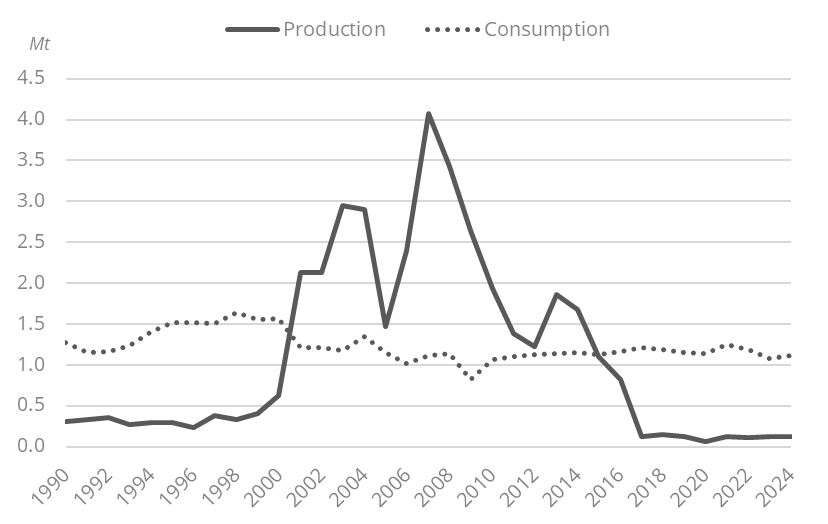
Norway Coal and Lignite Production & Consumption
Coal and lignite production has been decreasing since its peak of 4 Mt in 2007 to 119 kt in 2024. Since 2015, the coal trade balance has reversed, with imports accounting for 93% of coal consumption in 2024.
Coal consumption is relatively low and has remained roughly stable since 2010, at 1-1.2 Mt/year. Coal is mainly used in industry (70% of consumption in 2024), especially in the metallurgical industry.
Graph: Coal Production & Consumption
Source: Norway energy report
Interactive Chart Norway Coal and Lignite Production & Consumption
Source: Global Energy & CO2 data
Benefit from up to 2 000 up-to-date data series for 186 countries in Global Energy & CO2 data
View the detailed consumption trends at country level (graphs, tables, analysis) in the Norway energy report
Norway Renewable in % Electricity Production
Norway and Sweden have a common green certificate market since 2012 with the target of raising electricity generation from renewables by 28.4 TWh (equally divided between the countries) over 2012-2020. This goal was reached in 2019, and the system should close in 2035. In 2020, the government set new target of adding 40 TWh of new renewable generation by 2030, with a specific effort on offshore wind power.
Source: Norway energy report
Interactive Chart Norway Share of Renewables in Electricity Production (incl hydro)
Source: Global Energy & CO2 data
Benefit from up to 2 000 up-to-date data series for 186 countries in Global Energy & CO2 data
Learn more about renewables in the European Battery Market Analysis
Norway GHG emissions and CO2 emissions
In its updated NDC (2025), Norway maintained its 2030 GHG emission reduction target of 55% from a 1990 baseline and set a new target of 70-75% reduction for 2035. The target doesn't include land use, land-use change and forestry (LULUCF), and puts Norway in line with the EU's goals of cutting emissions by 55% between 1990 and 2030. Consequently, Norway's GHG emissions should reach 23 MtCO2eq in 2030.
Source: Norway energy report
Interactive Chart Norway CO2 emissions
Source: Global Energy & CO2 data
Benefit from up to 2 000 up-to-date data series for 186 countries in Global Energy & CO2 data
View the detailed consumption trends at country level (graphs, tables, analysis) in the Norway energy report