Solar capacity soared again in 2017 (+73 GW), while wind additions slowed
With China and India investing in renewables to boost their power supply and meet their Paris Agreement commitments and technology costs steadily decreasing, global renewable capacity additions continued to gain momentum in 2017: nearly 47 GW of wind capacity and close to 73 GW of solar capacity were added worldwide during the year, bringing the respective cumulative capacities to 512 GW and 369 GW.
Figure 1: Global cumulative wind and solar capacities
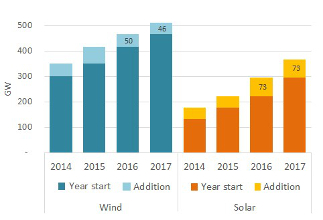
Source: Enerdata - Global Energy & CO2 Data, Power Plant Tracker
Global wind installations slowed down for the second year in a row (from +64 GW in 2015 and +50 GW in 2016). In China, wind installations have been declining since 2015 (+35 GW, due to a rush before feed-in tariff cuts) to +17 GW in 2016 and +15 GW in 2017, despite the government’s efforts to promote renewables and shift away from coal power (wind target of 200 GW by 2020). In addition, project and grid connection approvals have been suspended in some provinces since 2016, to reduce high curtailment rates. With at least 15 GW added during the year (1/3 of the new capacity worldwide), China remained the world’s largest wind market and reached 164 GW, i.e. approximately 1/3 of global wind capacity, followed by the United States with 88 GW, Germany with 56 GW and India with 33 GW. In the United States, wind installations slowed down to 6.2 GW after a record year (+8.7 GW in 2016, when wind project developers rushed to qualify for full federal production tax credits). However, wind installations surged in India (+3.7 GW to 33 GW, compared to a 60 GW target by 2020), Brazil (+2 GW) and South Africa (+621 MW). In Europe, more than 15 GW of wind projects were installed: wind capacity soared in Germany (+6.1 GW in 2017, compared to +5.1 GW in 2016), the United Kingdom (+4.3 GW, compared to +739 MW in 2016) and France (+1.7 GW), as project developers sought to benefit from support schemes while they still apply. In addition, Turkey added 766 MW during the year, supported by an ambitious wind policy (approval for the 1 GW YEKA project). In 2017, more than 4.3 GW of offshore wind capacities were installed, nearly twice as much as in 2016 (2.3 GW), thanks to new projects in the United Kingdom (+1.7 GW), Germany (+1.2 GW) and China (+1.2 GW).
Figure 2: Wind and solar capacity additions by country since 2014
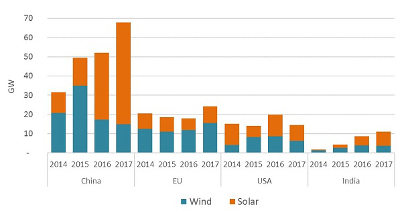
Source: Enerdata - Global Energy & CO2 Data, Power Plant Tracker
In 2017, nearly 73 GW of new solar capacity was added worldwide, thanks to a capacity boom in Asia: solar capacities rose by nearly 53 GW to reach 130 GW in China (+50% compared to 2016 additions) and by 7.5 GW to surpass 17 GW in India. Both countries have set ambitious solar targets (110 GW and 100 GW by 2022, respectively). Solar capacities also continued to build up in the United States with nearly 8.2 GW added in 2017 to reach 42.9 GW (11.3 GW added in 2016). Solar capacities surged in Europe in 2017, especially in Germany (+1.6 GW to nearly 43 GW), in France (+875 MW to 8 GW) and in the Netherlands (+610 MW to 2.4 GW).
Overall, renewables accounted for nearly half of capacity additions in the United States, for around 60% in China and 70% in India, requiring new investments in power grids and storage systems to offset intermittent generation. Despite these significant renewable additions, fossil power capacities continued to progress in 2017: 1/3 of the new capacities installed during the year in China were fossil (around 48 GW), while more than 10 GW of fossil capacities were added in the United States.