Market turbulence and manufacturing competition
Get this executive brief in pdf format
Since 2021, the solar photovoltaic (PV) modules market has experienced explosive growth, driven predominantly by the aggressive expansion of Chinese manufacturers, who maintain their dominance of global shipments. According to Enerdata, the top 25 manufacturers increased their combined shipments from 172 GW in 2021 to a staggering 687 GW by 2024—a more than 300% surge in just four years. This remarkable expansion reflects the broader global solar market boom, with total installations reaching nearly 600 GW in 2024, a 33% increase over the previous year. Behind this growth lies an intense competition landscape: while production capacities soar past 800 GW, profitability tightens amidst innovation pressures and price declines. Meanwhile, new manufacturing hubs are emerging worldwide as Europe and the U.S. ramp up domestic production to secure supply chains and navigate trade challenges.
This article delves into the latest market dynamics, production capacity trends, and the evolving competitive landscape shaping the solar PV industry today.
A Strong Increase of Module Shipments
Enerdata has been tracking the solar PV modules shipments for several years, since 2021the market has witnessed substantial growth in production and shipment capacities. This surge is fuelled by the aggressive expansion of Chinese manufacturers, who dominate the market. The largest 25 manufacturers tracked by Enerdata show combined PV modules shipments increasing from 172 GW in 2021 to 687 GW in 2024, a 300% increase in 4 years1.
Figure 1: Tracked PV Modules Shipments in GW
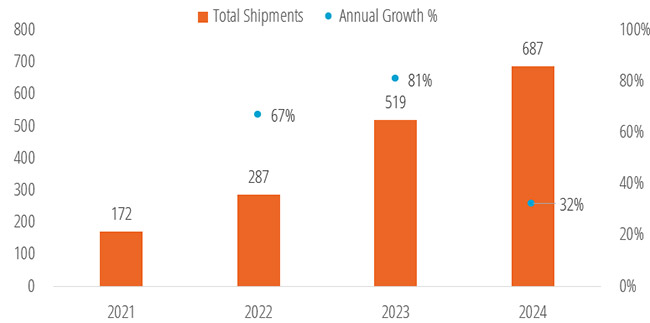
Source: Enerdata, based on raw data from annual companies’ reports and public news.
For several years, the Chinese companies have been dominating the manufacturing and supply of solar panels with only 1 or 2 maximum of non-Chinese companies make it to the list of 10 manufacturers. In 2024, the top 10 companies by modules shipment stayed unchanged compared to 2023, with some players trading placed. The top four players sustained their positions from 2023 while growing their overall shipments. Jinko Solar maintains its 1st place with shipments increasing from 79 GW to 93 GW, followed by Longi, which increased its shipments from 68 GW to 78 GW. Both Trina Solar and JA Solar share the 3rd place with shipments of 77 GW each. Canadian Solar retreated from the 5th position in 2023 to the 7th place in 2024 with an identical shipment volume of 31 GW in both years. TW Solar (Tongwei) and Astronergy (Chint) moved up to the 5th and 6th places with 49 GW and 40 GW module shipments, respectively. GCL (25 GW), Risen Energy (25 GW), and DAS Solar (23 GW) completed the top 10 by modules shipments.
Figure 2: Historical Modules Shipments in GW
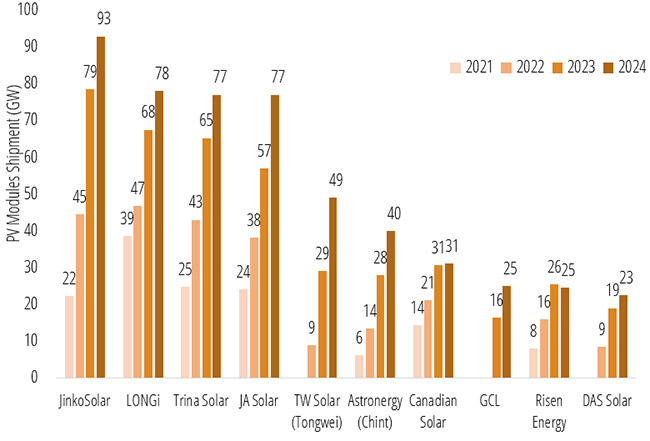
Source: Enerdata, based on raw data from annual companies’ reports and public news.
The top 10 achieved an average shipment volume increase of 27% between 2023 and 2024, except for Risen Energy, whose shipments decreased by 4%. The highest annual shipment increase is achieved by TW Solar (+69%), followed by GCL (+52%) and Astronergy (+43%). Beyond the top 10 by modules shipments, other notable manufacturers achieved significant shipments in 2024, such as Yingli (20 GW), DMEGC (17 GW), First Solar (14 GW), and Seraphim (12 GW). The shipments of the following companies are below the 10 GW threshold 1.
As of total market share based on PV modules shipments, Jinko Solar leads with 13%, followed by Longi, Trina solar, and JA Solar, each with around 11%. The next tier includes TW solar (7%), Astronergy (6%), Canadian solar (5%), GCL and Risen Solar (4%), and DAS Solar (3%). Beyond the top 10, notable manufacturers include Yingli (3%), DMEGC (2%), First Solar (2%), Seraphim (2%), while the remaining 16% (107 GW) is held by other manufacturers.
Figure 3: PV Modules Shipment & Market Share (GW; 2024)

Source: Enerdata, based on raw data from annual companies’ reports and public news.
Increase of Production Capacity and Lower Utilisation Rate
The industry is growing rapidly, and operational production capacity is expanding accordingly. In addition to existing capacity, numerous players are planning or constructing large-scale production facilities, continually increasing their output and diversifying their manufacturing base across several countries—a strategy likely aimed at overcoming trade barriers. For example, Jinko is planning a 3 GW solar module production facility in Vietnam, as well as a 10 GW cell and module facility in Saudi Arabia. Similarly, JA Solar has announced a 3 GW facility in Oman and a 2 GW facility in Egypt, while Longi is developing a 1.6 GW facility in Indonesia, among others 2&3.
In 2024, the top 10 manufacturers by module shipments collectively reached over 805 GW of production capacity, with combined module shipments amounting to 517 GW. This resulted in a 65% utilisation rate, which, despite appearing low, represents an improvement compared to 2023, when the utilisation rate for the same top 10 manufacturers was 59%. The highest utilisation rate in 2024 was achieved by GCL (83%), followed by Trina Solar and JA Solar (77%). The lowest utilisation rates were recorded by Canadian Solar and Longi, both with 52%. Notably, Canadian Solar added 3 GW of production capacity while maintaining the same shipment volume as in 2023. Longi significantly expanded its production capacity by 30 GW (+25%) in 2024, though its module shipments grew by only 15% compared to 2023. Longi remains the largest manufacturer in terms of production capacity with 150 GW, followed by Jinko Solar with 130 GW.
Figure 4: PV Modules Production Capacity, Shipment & Utilisation Factor (GW; 2024)
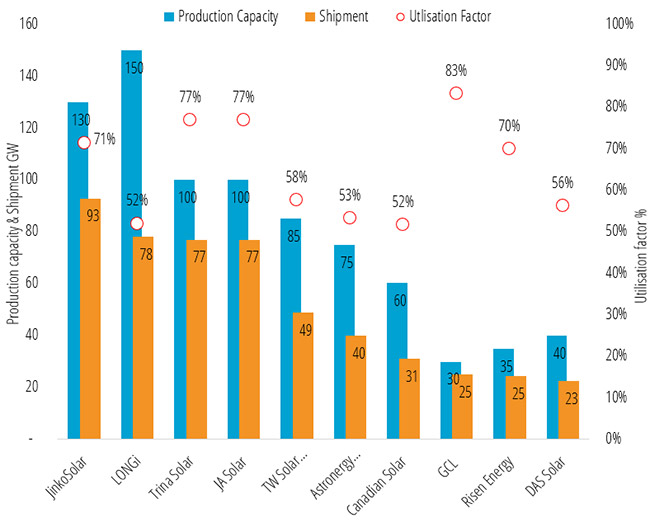
Source: Enerdata, based on raw data from annual companies’ reports and public news.
Declining profitability and increasing financial stress
As competition intensifies, profit margins are shrinking for most key players, who struggle to maintain healthy profitability while simultaneously investing in R&D and production expansion. Continuous price declines and aggressive competition restrict companies’ ability to manoeuvre and balance their finances. In 2024, Zhejiang Akcome Photoelectricity Technology filed for bankruptcy, citing an inability to meet debt obligations4.
With average selling prices for utility-scale modules hitting historic lows—dropping to $0.08–$0.10 per watt— manufacturers across the board felt a severe margin squeeze5. One source reports that the top 10 module manufacturers suffered combined losses of $4 billion in 2024, amid year-over-year revenue declines. A recent report employed the Altman Z-Score6, according to which six of the top 10 manufacturers—including Jinko, Longi, Trina, Astronergy, TW Solar, and JA Solar—fell into the grey zone, showing worsening financial health compared to the previous year, with the exception of Jinko, which improved its score in 2024.
Focusing on the largest players, the top five manufacturers experienced significant revenue declines in 2024 versus 2023, despite increased module shipments. Furthermore, all top five companies reported substantial losses in 2024, contrasting with their positive earnings or smaller losses in the prior year7.
Jinko Solar reported an operating loss of -$0.47 billion while revenues were $12.64 billion down 22.3%, gross profit $1.37 billion, down 47.4% and gross margin of 10.9% down 5.1%8. Longi’s revenue hit $11.5 billion down 37%, net loss $1.3 billion compared to profit of $1.75 billion and a growth margin 7.4%9. Trina made a revenue of $11.15 billion a decrease 30%, loss of -$0.26 billion compared to earnings of 2023 of $1.10 billion10. JA Solar gained a revenue of $9.7 billion a decrease 18%, loss of -$0.65 billion compared to $1 billion earnings in 202311. Tongwei achieved a revenue of $12.8, a decrease of 51%, loss of - $1.2 billion compared to losses of - $1 billion in 202312.
Market dynamics
Reshuffling production bases
The market continues to feature a rapid cycle of innovation and technology deployment with technologies like TOPCon, HJT, and IBC achieving higher efficiency compared to older technologies13. Companies invest considerable amounts on innovation and new technologies to ensure their survival in the competition landscape. Some estimates put industry average R&D investments at 4%14. However, these investments increase financial pressure with only marginal impact on the market. Coupled with overcapacity and continuous expansion, this creates downward price pressure, leading to fierce competition for market share at the expense of profitability. Meanwhile, the market actually seeks standardised, certified, mass-produced, and stable modules.
Striking this fine balance between these different dynamics is what differentiates successful companies. For the European market, brands must not only provide efficient modules but also meet stringent regulations, be responsive to local EPCs, and participate in public tenders, with failure to do so raising project complexity. Furthermore, European and American markets are gradually transitioning to favour locally produced components, with considerable strategies advocating local production increasing barriers on imports. These two markets still see locally produced modules prices higher than Chinese imported modules, even after levies and import taxes. This is attributed to the extensive integration of the Chinese solar industry value chain, the massive production scale, and the size of local demand in China, which absorbs a considerable percentage of the production.
Europe and the USA Manufacturing Evolution
Escalating trade wars—particularly between the USA and China—have introduced trade barriers and increased import levies. Moreover, growing concerns over supply risks and trade imbalances that could be weaponised as political leverage have contributed to a resurgence of local solar manufacturing. Both Europe and the USA have announced substantial new solar PV production capacities. At the same time, Chinese companies have dispersed some of their new production facilities across multiple countries to circumvent trade barriers targeting Chinese products.
The Net Zero Industry Act (NZIA) sets an ambitious target for the European Union: achieving 30 GW of domestic solar photovoltaic (PV) manufacturing capacity across the entire value chain by 2030. Building this capacity represents a significant challenge. According to Enerdata, the EU currently operates around 60 plants producing PV modules, with a combined manufacturing capacity of 8.4 GW. However, over the past two years, approximately 2.4 GW of capacity has been shut down, and an additional 2.7 GW has been put on hold15.
Despite these setbacks, more than 50 GW of additional PV module manufacturing capacity has been announced for completion by 2030. Notable projects include AE Solar in Romania, Siliconvalen in Spain, and Holosolis in France. Furthermore, around 20 GW of ingot and wafer manufacturing capacity has also been announced. The question remains whether these announcements will translate into operational factories.
However, these potential production capacities are far from meeting the increasing demand of solar PV installation in Europe that reached 65 GW16 in 2024 and projected to reach between 81 GW and 112 GW in 2028. Similarly, on a larger energy scale, according to Enerdata’s Enerfuture scenarios17 & 18. According to Enerfuture, by 2030 the share of renewables in the European primary energy could reach 18%, 23% or 28% according to the scenario. This implicated an installed solar energy capacity of 2.6 thousands GW, 3.5 thousands GW or 5 thousands GW respectively. These capacities are far from the 2024 installed capacity of 338 GW 15.
Figure 5: Share of renewables in primary consumption in Europe
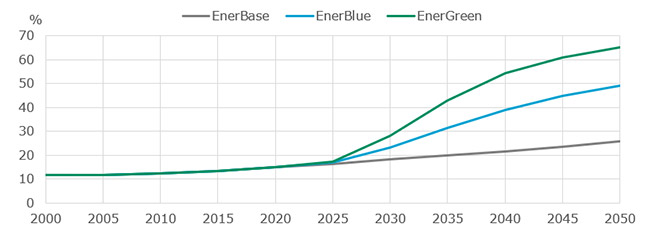
Source: Enerdata, EnerFuture
Figure 6: Scenarios of Installed Solar PV Capacity in Europe
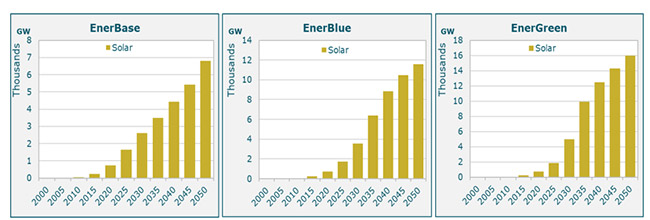
Source: Enerdata, EnerFuture
In Q3 2024, the United States reached a record-breaking 9.3 GW of new solar module manufacturing capacity. Five new or expanded factories in Alabama, Florida, Ohio, and Texas brought the total U.S. solar module manufacturing capacity to nearly 40 GW19. In the same quarter, First Solar and Runergy opened a 3.5 GW and 5 GW PV modules facility, respectively, both located in Alabama. The NREL estimates the available nameplate production capacity in the USA at 50 GW as of 2024209.
U.S. Solar Market Insight Q4 estimates that the USA currently has 24.1 GW of PV module production capacity under construction, and another 13.1 GW announced. Within 2024, the country brought online 24 GW of new module production capacity, a momentum spurred by the Inflation Reduction Act (IRA)21. However, the Trump administration has tightened renewable energy tax credit and rescinded the designation of solar manufacturing as critical to national security. As such, the industry stays alert to these changes and potential negative impacts on the industry22.
Conclusion
The solar industry is projected to continue its exponential capacity as solar energy anchors its position as the cheapest source of energy. While the key players pertain their leading position in the top list, financial stress and declining profit margins might push them to take corrective actions to lower the pressure and appeal to their stakeholders. The Chinese government and industry are already taking steps to curb overcapacity and stabilise pricing. This includes measures to control investment, promote industry collaboration, and potentially implement production cuts23. Trump trade wars and retaliatory measures from China and other countries could increase solar modules prices and push more producers to diversify their production bases.
NOTES:
- Source: Enerdata, Hydrogen and Derivatives Projects Database.
- Jinko Solar to Add 7GW of Capacity for Solar Cells and Modules in Vietnam – PVTIME
- JA Solar to invest in solar manufacturing hub in Oman – pv magazine International
- Chinese solar firm Akcome's subsidiary declares bankruptcy | Reuters
- bnef: clean-energy-3q-2024-global-pv-market-outlook
- A metric assessing financial health through profitability, leverage, liquidity, solvency, and activity ratios, ranking companies into three categories: green (safe), grey (stressed), and red (distress zone).
- Solar and storage manufacturer financial health rankings | Q4 2024
- JinkoSolar Announces Fourth Quarter and Full Year 2024 Financial Results
- LONGi Investor Presentation for FY2024 and 2025Q1 Results
- Trina Solar (688599.SS) - Earnings
- 1223999280.PDF
- TONGWEI (600438.SS) Income Statement - Yahoo Finance
- Top 10 Global Photovoltaic Module Manufacturers in 2025 - Module Manufacturer
- Top ten solar PV module manufacturers show resilience in H1 2024 despite facing significant headwinds
- Capacities on hold correspond either to existing sites being put on hold, or to projects being paused.
- eu-market-outlook-for-solar-power-2024-2028 - SolarPower Europe
- World Energy Forecasts & Modelling | EnerFuture
- A Global Energy Forecasts modelling various energy demand and supply scenarios & associated GHG emissions up to 2050, modelling 3 scenarios. EnerBase based on existing policies and historical trends, EnerBlue based on the successful achievement of NDCs (Nationally Determined Contributions) & EnerGreen where global temperature increase is below 2 °C.
- syncarpha: 2024/09/u-s-solar-manufacturing-capacity-q2-2024-analysis
- Fall 2024 Solar Industry Update
- taiyangnews.info/business/us-solar-pv-installations-q3-2024-report
- www.pv-tech.org
- China moves to curb solar overcapacity, stabilize pricing – pv magazine International