Projecting oil and gas market prices towards 2050
Request the publication (FREE)
The last five years have been marked by one of the most volatile developments in oil and gas prices in the markets’ history. In early March 2026, the start of the US-Israel Iran War led to fossil fuel price spikes, raising once again concerns as to the future of oil and gas prices on international markets.
Building upon accurate historical data up to March 6th, this analysis describes the drivers underlying EnerFuture’s fossil fuel market price projections, with a focus on oil (Brent), and on natural gas in Europe. Enerdata’s oil and gas price projections capture both short-term price dynamics, driven by current geopolitics and economic activities, and long-term price dynamics, mainly influenced by energy demand.
Rewinding five years of oil and gas market dynamics
Oil price evolution: COVID pandemic and geopolitical tensions
Since 2021, oil markets have been largely driven by the recovery from the COVID pandemic, geopolitical conflicts, and shifting macroeconomic policies, leading to five years amongst the most volatile in oil market history.
Indeed, early 2021, Brent was sold at approximately $50/bbl. After the COVID pandemic, oil demand recovered faster than the supply combined with production cuts maintained by OPEC+ (Organisation of the Petroleum Exporting Countries). Those combined effects pushed prices steadily upward, up to around $75-80/bbl at the end of the year.
2022 was the most turbulent year of the period. After the invasion of Ukraine in February 2022, prices skyrocketed due to fears of disruptions in Russian supplies. In June, Brent peaked at $130/bbl, its highest level since 2008. In the second half of the year, high interest rates imposed by central banks (to fight inflation) led to the fear of a global recession, bringing prices back down to an $80/bbl average by December.
In 2023 the market was torn between supply restrictions and economic headwinds. On the supply side, Saudi Arabia and Russia implemented significant voluntary production cuts to support prices, whereas on the demand side, high interest rates and a slower-than-expected economic recovery in China put downward pressure on the Brent price. Over the year, prices generally fluctuated between $72 and $95/bbl, with peaks due to the Israeli-Palestinian war and rising tensions in the Red Sea, averaging around $82/bbl for the year.
Throughout 2024, the market has been influenced by two opposing dynamics. On the one hand, the conflict in the Middle East and numerous attacks on shipping in the Red Sea provided a geopolitical "risk premium", keeping prices from falling too low. On the other hand, the non-OPEC supply led to a record-breaking production from the United States, Guyana, and Brazil, compensating for OPEC+ cuts. Brent ended up averaging $80 bbl in 2024.
In 2025, oil prices continued their downward trend, averaging $68/bbl, due to a slow-down of the Chinese economy, sluggish demand in India and relatively abundant supply outside OPEC+.
Figure 1: Brent Spot Price and Futures Price
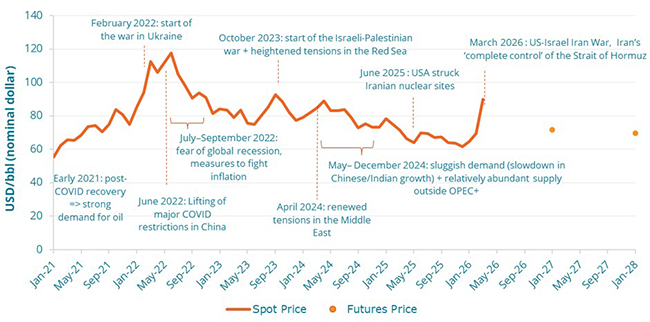
Source: Enerdata, EnerFuture
In March 2026, following the US-Israeli Iranian war, and the “complete control” of the Strait of Hormuz by Iran, oil prices skyrocketed by more than +30% in less than a month, ending up at $102/bbl on 16th March. The agreement to increase the production of 200,000 barrels per day in April by OPEC+ seems anecdotical compared to the stop of nearly one fifth of oil production out of the Strait of Hormuz, which is mainly exported to Asia.
Brent is currently sold on Future markets for 2027 at $76/bbl.
Natural gas price in Europe: the impact of a shift in the EU supply strategy
Gas prices also went through a turbulent period over the past five years, which were heavily marked in the European Union by a shift from the dependence on Russian pipeline gas to a more significant reliance on a globalised Liquefied Natural Gas (LNG) market.
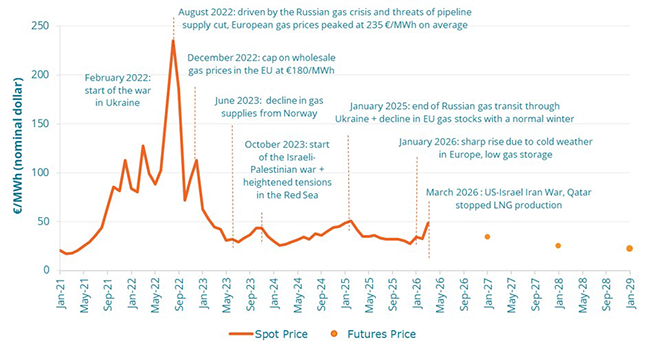
Indeed, gas prices started to rise in 2021, due to the combination of both a long and cold winter that left low stocks after the post-pandemic economic rebound, and a notable decrease in Russian "spot" supplies. By December, prices had already reached over €150/MWh, as tensions at the Ukrainian border intensified.
2022 was the climax of the energy crisis, with unprecedented volatility following the invasion of Ukraine. In August, the Title Transfer Facility (TTF)1 price hit an all-time intraday record of approximately €340/MWh. This was driven by a rush by EU member states to fill storage facilities for the winter at any cost, gas storage functioning as a safeguard against unexpected supply or demand disruptions. Prices got lower (around €70–80/MWh) at the end of the year, thanks to a very mild start to the winter and a massive influx of LNG, primarily from the United States.
2023 was a year of stabilisation of the price at a higher level than the pre-crisis period. Europe successfully replaced most of Russian pipeline gas with LNG and pipeline gas from Norway. Industrial shutdowns and households savings contributed to an average 7% reduction in natural gas consumption. Prices generally fluctuated between €30 and €55/MWh.
In 2024 the market reached a fragile stability. Europe entered the year with record-high storage levels (over 80-90% full in many regions), and TTF prices therefore stayed relatively range-bound between €25 and €45/MWh.
In 2025, gas prices kept a downward trend until December, with a low point at 28 €/MWh. In September, the EU lowered the binding minimum storage requirement at the start of winter to 75%, down from the previous 90%, helping therefore the price trend down. By the end of 2025, much of the gas previously supplied by Russia had been replaced by LNG, imported mostly from the United States.
After the 2025 downward trend, prices bounced back in the beginning of January 2026, following a cold snap in Europe and ongoing geopolitical uncertainties. In March 2026, after the start of the US-Israel Iran war, TTF prices went up rapidly. In response to strikes, Qatar stopped its LNG production and the Strait of Hormuz is under Iranian control2.
The price development for natural gas in the first weeks of 2026 is only a hint of what could happen in the future – even if the market foresees a long-term reduction according to future prices.
Gas prices are expected to stabilise at a low level in the years ahead. Indeed, Future prices are expected to reach €30/MWh for next year’s delivery, and €22/MWh for 2029. Still, this remains heavily influenced by market speculation and geopolitical developments, raising the risks of significant price spikes in the future.
Looking ahead: which drivers for long-term price dynamics ?
As a basis for building its own price projections, Enerdata uses future prices up to Y+3 for both natural gas and oil, so as to capture short-term dynamics and embed in its trajectories the political instabilities, economic activities and growth perspectives underlying ongoing price formation.
The long-term price dynamics, however, is mainly influenced by the demand of the related energy carrier. Enerdata’s projections are therefore built using the POLES-Enerdata model, which is particularly well-suited to account for the long-run equilibrium between demand and supply.
The following analysis describes three contrasted energy-climate scenarios up to 2050, exploring possible pathways for the global energy sector:
- EnerBase is a baseline scenario that assumes the continuation of existing policies and trends
- EnerBlue assumes the achievement of national objectives submitted up to the end of 2024
- EnerGreen is an ambitious scenario assuming the achievement of a GHG emissions budget aligned with the Paris Agreement and a temperature increase well below 2°C.
The impact of global oil demand on long-term oil prices projections
Oil markets will go through a fundamental transformation as the drivers of global oil supply and demand patterns shift. Over the past decade, oil market dynamics have been defined by a parallel growth in both US oil supply and Chinese oil demand. However, oil demand and supply pictures are bound to evolve drastically over the next decades.
Indeed, global oil consumption is expected to decrease in all EnerFuture scenarios. While this decrease is significant in EnerBlue and EnerGreen - respectively -41% and -64% in 2050 compared to 2025 -, it is more moderate in EnerBase, with only a 7% decrease in oil consumption over the next 25 years.
However, the scenarios provide insights on some regional discrepancies. In Europe, regulatory constraints on thermal vehicles, the ramp up of electric vehicle (EV) sales, and carbon taxes on oil products drive oil demand downward. In the European Union, oil demand - which already peaked in the 2010 decade - is expected to decrease by 11%/year in EnerBlue and by 2%/year in EnerBase.
China, driven by a surge in EV sales, the continued deployment of trucks (including E-trucks and LNG trucks), a strong development of the country’s high-speed rail network, and structural economical shifts, sees its oil demand on track to peak during the next decade. In the EnerBase scenario, China’s final oil consumption is expected to peak in 2032 with roughly 680 Mtoe, whereas this peak occurs in 2025 in EnerBlue, due to a stronger acceleration of EV sales.
India and Africa are the only world regions expected to experience an upward trend in oil demand in the EnerBlue scenario, by an average growth rate of 1.4%/year and 3.4%/year, respectively.
While the use of oil in the aviation and maritime sectors have been so far relatively unaltered by direct substitution effects (electrification and other non-oil alternatives) currently at play e.g. in road transport, this might also be subject to change in the future.
On the supply side, from 2015 to 2024, the United States accounted for 90% of the increase in global oil supply, with the shale boom lifting US oil production. The 2030 and 2050 pictures look very different. The pace of expansion in US oil production is indeed slowing down, and the retrofit of the Venezuelan oil infrastructures still appears very uncertain.
In the long term, the relatively high demand in EnerBase leads to the exploration and production of less accessible fields with higher costs (e.g. deep offshore, tight oil). The rapid development of tight oil and shale gas (especially in the USA) in recent years has led to an increase of the decline rate of oil production, therefore requiring strong investments to maintain the same level of production. In EnerBlue and EnerGreen, no significant investments are planned to offset the natural decline of oil fields.
In EnerBlue, the decline of current fields is quite aligned with the significant demand reduction observed, whereas in EnerGreen the reduction of demand overpasses the natural decline of oil fields, which ends up in reducing significantly the oil price towards 2050.
Figure 3: Global final oil consumption in the EnerFuture scenarios
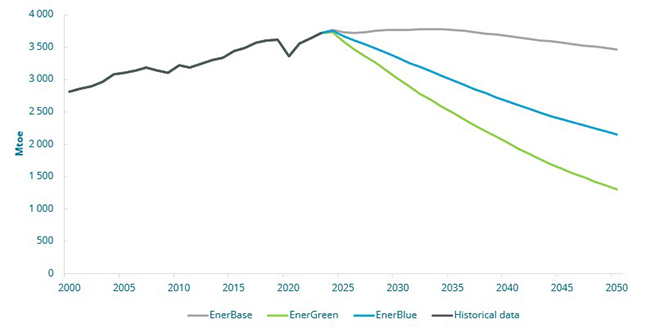
Source: Enerdata, EnerFuture
The above-mentioned context and drivers at play for the evolution of oil supply and demand could lead to contrasted long-term oil price trajectories amongst the three scenarios.
In EnerGreen, the strong reduction of global oil demand leads to a 50% reduction of the Brent price, ending up at $30/bbl3 in 2050. In EnerBlue, despite a strong decrease in oil demand (-41% between 2025 and 2050), the Brent price remains stable at around $65/bbl in 2050, as constraints on supply remain significant. Finally, in EnerBase, the decrease of oil demand occurs in 2035, after a plateau during the period 2025-2035. The relatively high consumption leads to the exploration and production of less accessible fields with higher costs, leading to a steady increase of oil prices, reaching ca. $100/bbl in 2050.
The EnerBase projection is more prone to price volatility due to potential market tension as oil demand remains relatively high the next decade.
Figure 4: Oil market price evolution in the EnerFuture scenarios
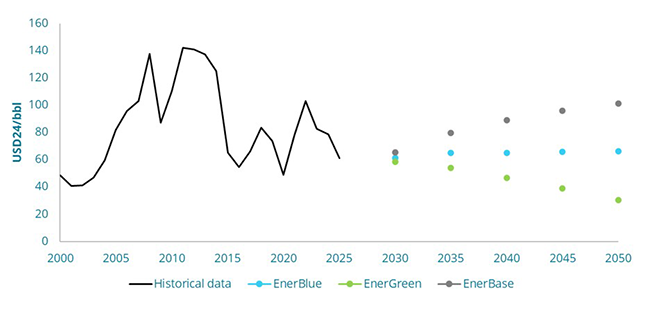
Source: Enerdata, EnerFuture
Long term projection of natural gas demand and associated prices – focus on the European market
In the European Union, natural gas consumption is expected to decrease drastically in both EnerGreen and EnerBlue, by respectively 86% and 80% in 2050 compared to 2025.
This decrease is notably driven by the buildings sector, almost experiencing a gas phase-out (-94% from 2025 to 2050 in EnerGreen, -91% in EnerBlue) due to the rise in the installation of heat pumps and a significant electrification of end-uses overall. Even in the EnerBase scenario, the consumption of natural gas in buildings decreases by 47% between 2025 and 2050, to 52 Mtoe.
In EnerGreen and EnerBlue, natural gas consumption also strongly reduces in the industry sector, by 75% and 66% respectively between 2025 and 2050, whereas it remains stable in EnerBase, with fewer incentives for fuel substitution and the electrification of industrial processes.
The buildings and industry sectors represent the majority of the natural gas consumed in the EU, with 60% and 39% respectively in 2025. The 1% remainder is consumed by the transportation sector, hence presenting a very limited potential for gas consumption reduction.
Since 2022, European countries (including the UK) have significantly increased their regasification capacity, primarily through the rapid deployment of FSRUs (Floating Storage and Regasification Units). LNG represented 45% of EU gas imports in 2025, compared to 20% in 2021. The structural demand reduction in gas consumption (renewable acceleration, industrial shift, heat pump adoption) might lead to a structural LNG overcapacity as long as Europe is planning to further develop its LNG infrastructure.
Figure 5: Final natural gas consumption in the EU
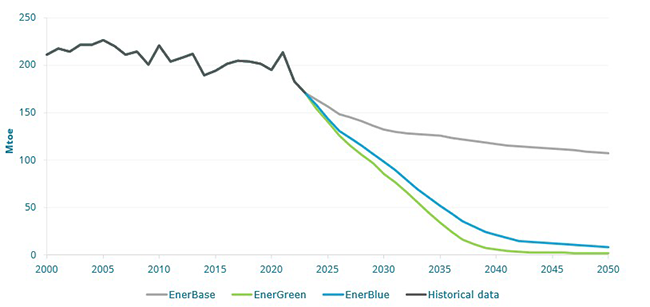
Source: Enerdata, EnerFuture
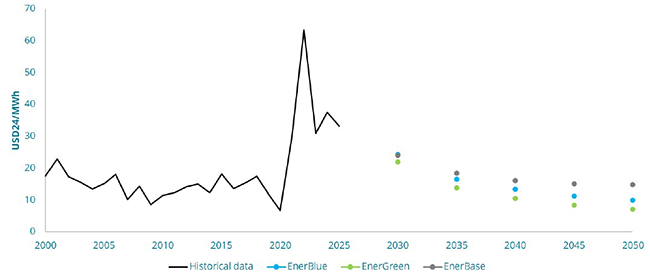
All three scenarios project a progressive decreasing trend in natural gas prices due to the reduction of final consumption in Europe. EnerBlue and EnerGreen present similarly decreasing trajectories with respectively around -4.7%/year and -5.9%/year, reaching around €9/MWh4 and €6.5/MWh in 2050.
In the EnerBase scenario, higher supplies of LNG tend to maintain the price at a higher level, reaching around €14/MWh in 2050 whereas in EnerBlue and EnerGreen an over capacity of LNG is planned combined with a strong demand reduction which lead to steady decrease of natural gas price.
Just like for the oil market, EnerBase gas price projection is more prone to volatility, due to potential market tensions on the LNG market in a context of relatively higher demand and constrained global supply.
KEY TAKEAWAYS
- Over the past decade, oil market dynamics has been marked by a parallel growth in both US oil supply and Chinese oil demand.
- Enerdata’s EnerFuture scenarios show that India and Africa will be driving oil demand upward, while China’s oil consumption is likely to plateau in the next decade, due to a strong electrification of road transport (both passenger and freight).
- The relatively high demand in EnerBase leads to the exploration and production of less accessible fields with higher costs (e.g. deep offshore, tight oil) leading to a steady increase of oil prices.
- In EnerBlue, Brent price remains stable until 2050, around $65/bbl. EnerGreen and EnerBase show more contrasted pictures, with prices ranging from $30/bbl to $100/bbl in 2050.
- European gas demand decreases drastically in all scenarios, leading to a strong decline in natural gas prices ranging from €9 to €14/MWh in 2050. In the EnerBase scenario, this decline is limited, to some extent, by global LNG supplies.
- Fossil fuel market prices being highly driven by both the geopolitical context and the future energy demand, the start of the US-Israel Iran War raises uncertainties as to the future of oil and gas prices on international markets.
Notes :
- TTF: primary benchmark for natural gas prices in Europe
- As of 6th March 2026
- Brent projected prices are expressed in US Dollars of 2024.
- Natural gas projected prices are expressed in Euro of 2024.