What’s Causing Rising Gas Demand in China and the US?
Get this executive brief in pdf format
This month, we examine the latest developments in gas markets, with a focus on the United States and China. This brief is by Karine Pollier, Enerdata’s Head of Energy Statistics and Morgan Crenes, Enerdata’s Head of Market Research.
G20 Energy & Emissions: Was 2018 a Repetition of 2017?
The latest final statistics show that 2018 was not exceedingly different from 2017, with very similar energy consumption trends. Global energy consumption in G20 countries continued to grow in 2018 at the rather same rate as in 2017 (+2.1%) with the most significant increases in natural gas (+4.8%) and electricity (3.7%). These growth rates are the result of robust economic growth in most G20 countries, plus increased heating and cooling needs in some countries. Figure 1 shows key figures for 2018.
Figure 1: Across the Board Consumption Increases in 2018
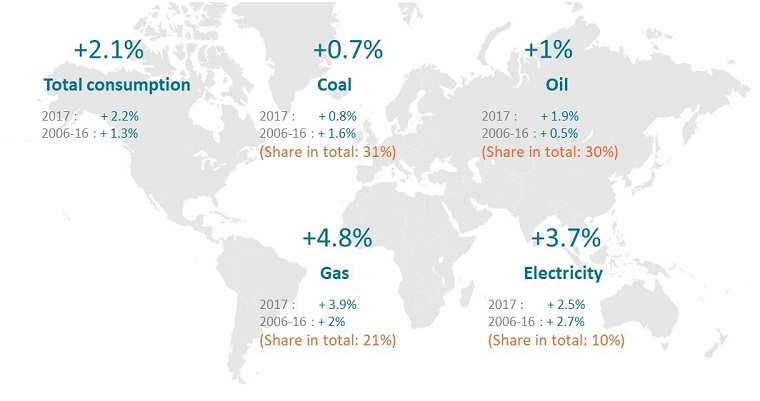
Source: Enerdata, Global Energy & CO2 Data
70% of Global Energy Consumption Growth from USA & China
Total energy consumption grew significantly in both countries in 2018 – with the USA logging the highest growth seen in the past 30 years, and China seeing its highest growth since 2012. In both cases, economic growth was the main driver. Energy consumption per unit of GDP (or “energy intensity” of GDP) decreased at a slower pace in China compared with previous years (-2.7% in 2018, against -3.7% in 2007 or -3% over the period 2000-2016). Meanwhile, this measure increased slightly in the US (+0.6%).
Figure 2: 2018 Growth in Consumption and GDP
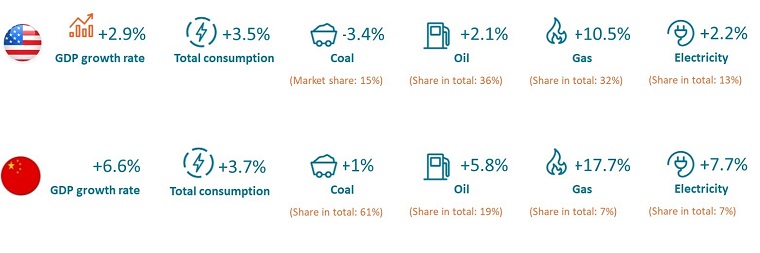
Source: Enerdata, Global Energy & CO2 Data
China: Changes on the Horizon, Yet Coal Remains Dominant
Coal is still the main energy consumed in China (at 61% in 2018) followed by oil, at 19%. Coal consumption grew rapidly in China for decades, mostly driven by power generation, as well as some industrial sectors, such as steel, chemicals and cement.
Figure 3: Evolving Total Energy Consumption Patterns in China Since 2010
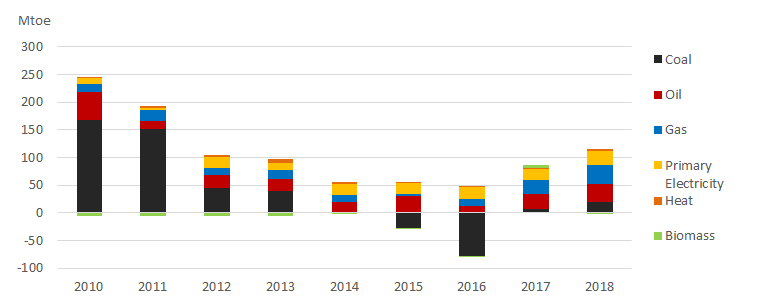
Source: Enerdata, Global Energy & CO2 Data
Still in 2018, coal consumption continued to rise (+1%), although we do see that a slowdown has been occurring, which began in earnest in 2012, encouraged by coal-to-gas conversion policies and the development of solar and wind capacities1.
Electricity consumption increased almost 8% in 2018, driven by both electricity-intensive industries, including cement and steel, and an increased demand for cooling. (In the residential sector, about 10% of electricity is used for air conditioning. In the service sector, this figure is higher.)
US: Multiple Factors Pushing Up Gas Consumption
In the US, coal consumption decreased significantly in 2018 (-3.4%), reaching its lowest level in 40 years as a result of the retirement of coal-fired power plants2. These retirements were driven by stronger emissions standards and the availability of cheaper natural gas for electricity generation.
Consumption of gas increased roughly 10% in 2018 after a decrease in 2017; around half of this increase was due to power generation. Electricity consumption increased by 2.2% (also after a decrease of 1% in 2017) driven by the residential sector (+6.2%) mainly due to the increasing electricity consumption for appliances ( representing around half of the electricity consumption) and air-conditioning (about 25% of total electricity used in the residential sector3).
Figure 4: Evolution of total energy consumption in USA since 2010
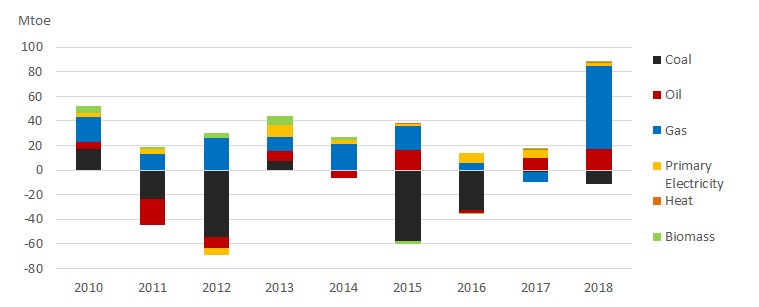
Source: Enerdata, Global Energy & CO2 Data
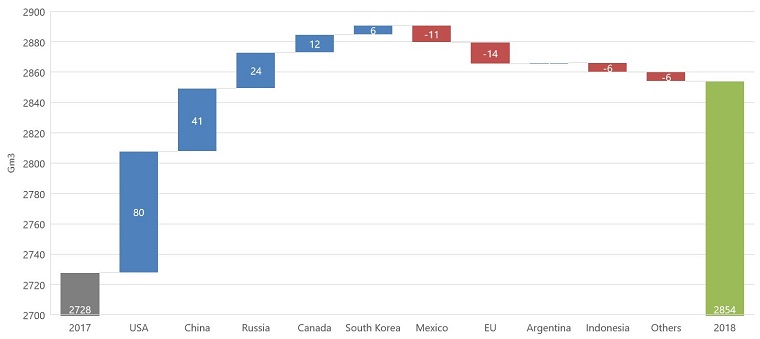
2018 Saw Spectacular Increase in Gas Demand in China & US
In G20 countries, gas demand increased for the second consecutive year in 2018, rising 4.8%. In the US, the driver was higher total demand for power generation, while in China it was substitution for coal. Meanwhile in Europe, gas demand is decreasing because of the economic slowdown, improved hydropower availability, and milder weather.
As a result, China become the second-largest contributor to global gas demand growth in 2018 (25%), behind the United States (48%).
Figure 5: The G20’s Largest Contributors to Gas Demand Growth, 2017-2018
Source: Enerdata, Global Energy & CO2 Data
Switching from Coal Drives Gas Demand Increase in China
China is turning to natural gas as a way to decrease air pollution from burning coal. In China’s 13th Five-Year Plan and the latest “Energy Production and Consumption Revolution Strategy” (2016-30), the Chinese government has set targets to increase the share of natural gas in the primary energy mix from 5.9% in 2015 to 10% by 2020 and 15% by 2030.
The Chinese government has also taken measure to reduce household reliance on coal by hastening the transition to natural gas. In 2017, a new “clean heating plan” set targets to shift around 3 million rural households in northern China from coal to cleaner heating every year over the next four years. China's policy objective is to reduce coal in the primary energy mix to below 58% by 2020, compared with 71% in 2010. As of 2018, reduction to 61% has been achieved.
Despite a slight (+1%) increase in coal consumption in 2018, coal consumption growth has been less than total consumption growth since 2012. In the meantime, gas consumption has averaged double-digit growth (11%) with +15% in 2017 and a peak of +18% in 2018.
Abundant Domestic Supply Supports US Gas Consumption
The US became the world’s largest gas producer in 2018. This is thanks to shale gas, which accounted for around 70% of total US gas production, and especially shale gas from growing tight oil production. Natural gas prices remain low in the US, due to abundant supply, and leading to both increasing domestic consumption in sectors and especially for electricity production, and growing exports of natural gas4.
The exceptional growth in gas consumption in 2018 (+10.6%), contrasted with a low growth rate from 2000 to 2017 (+1%/year), was mainly driven by power generation and the building sector where the consumption has increased by 12% in 20185.
Impacts on Gas Markets
According to Enerdata’s projections, worldwide gas demand should reach about 5 135 bcm in 2040 (compared with 3 758 bcm in 2017). A large share of this is from Asian countries, which should account for around one third of total demand growth (of which 15% for China). Gas will account for 26% of global primary energy demand in 2040 in the EnerBlue6 Scenario, versus 22% in 2018. Traded gas volumes will mechanically increase with imports from main importing countries doubling between 2017 and 2040 in EnerBlue.
Figure 6: Net Gas Imports Increasing Significantly in China and India
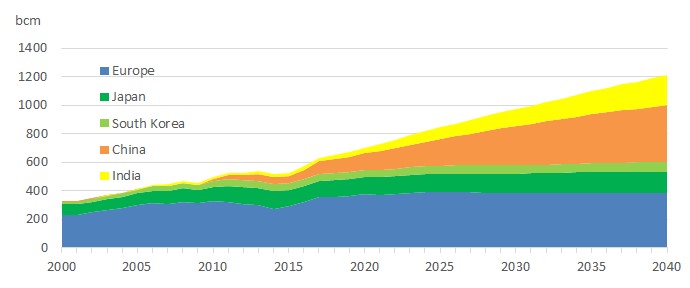
Source: Enerdata, EnerFuture, Global Energy & CO2 Data
LNG business will be strongly impacted, with its share in global traded gas rising from one third in 2017 up to 60% by 2040. Regarding supply, Australia and the US were the main contributors to the 2018 increase in LNG export capacity, representing 50% and 30% of total additions, respectively. The US is a new-comer in the LNG market and is still far behind the two leaders – Qatar and Australia7. Despite growing domestic demand, abundant US shale gas production will result in growth in the US share of LNG market over the next five years.
Figure 7: US & Canada Will Lead Growth in LNG Liquefaction Capacities
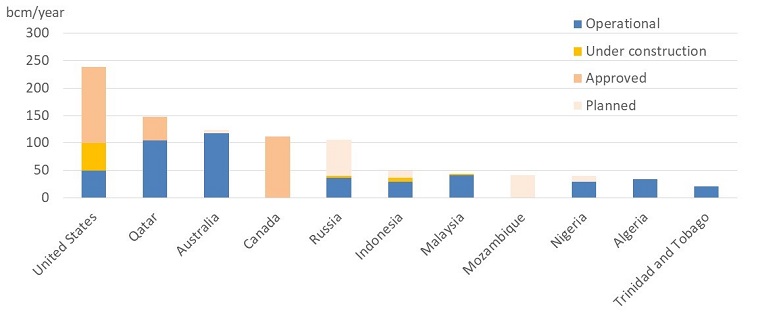
Source: Enerdata, World LNG database
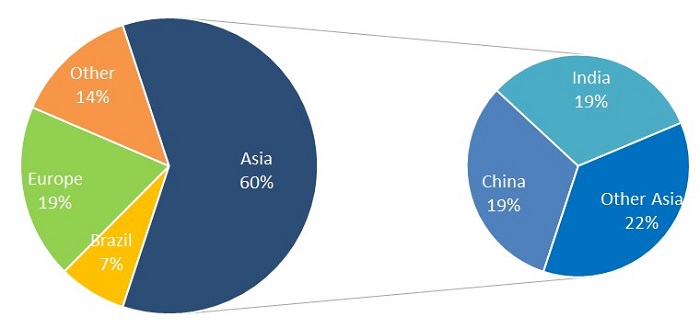
On the demand side, Asia will drive growth in LNG imports and will require significant developments in regasification capacities. These will be mainly concentrated in China and India, but also in Europe, with each expected to supply 19% of future developments.
In China – which became the second largest importer in 2018 (behind Japan) and could become the largest importer by 2030 – LNG imports will bridge the gap between domestic production, pipeline imports and growing demand. China’s growing dependence on LNG importation will make the country a key player in gas markets.
Figure 8: Asia Dominates Global LNG Regasification Capacities Planned & Under Construction
Source: Enerdata, World LNG database
Market Uncertainties from Unexpectedly High Demand
Overall, in the short-term there was a general expectation of a massive LNG wave arriving – and bringing down natural gas prices worldwide – due to major increases in LNG export capacity in recent years mainly from Australia, but also from the US and other countries. (Australia just overtook Qatar as the world’s largest LNG exporter.) So far, this has not happened. This is due to very strong and unexpected increase in LNG demand from China, which has absorbed all of the gas surplus. In the long-term, it is still unclear how the dynamics of supply and demand will play out and thus international spot prices given the significant additional export capacities planned in North America but also in Qatar, Africa and elsewhere. What is clear is that on the demand side much will depend on the LNG absorption capacity of China.
To What Extent Will Natural Gas Support the Energy Transition?
Both gas demand and gas trade are both expected to grow, but will they play a significant role in slowing down global temperature rise? Despite being a fossil fuel, the low carbon content of natural gas, plus its higher efficiency compared with coal, makes it a viable option to reduce GHG emissions8.
Natural gas could play a significant role in decreasing GHG emissions from the power sector by replacing coal in power plants. Fossil fuels being switched to gas could account for around 20% of total emissions reductions in the power sector (cumulatively through 2040), slightly more in the US, from a baseline scenario to a scenario achieving NDCs objectives according to EnerFuture and AERO analytics tool.
Natural gas would also play a major role in achieving the necessary power sector emissions reductions that would be in-line with a limitation of global temperature increase to +2°C in the long-term (at the world level 14% of cumulative reduction by 2040). In terms of dynamics, gas would play a significant role in the short- and medium-term, while renewable energies will be the main solutions in the long-term.
Figure 9: Power Sector Emissions Reductions options to achieve 2°C objective
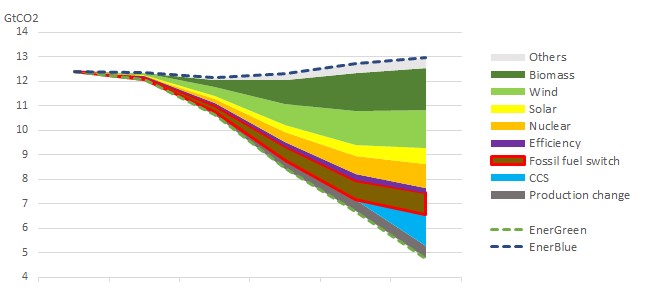
Source: Enerdata, EnerFuture, AERO
Footnotes:
- Solar capacity additions of 44 GW in 2018, and 20 GW for wind.
- About 13 GW of coal-fired capacities were retired in 2018 and 14.5 GW of new gas-fired power capacity were added.
- Nearly 90% of 10 US homes use centralized or individual air conditioners.
- U.S. exports of LNG reached 28 bcm in 2018 representing 22% of gas exports. Taking into account the various LNG export projects currently under construction and to be completed by 2020, LNG exports are expected to 100-110 bcm in 2020 and will make up a growing share of natural gas exports, even surpassing pipeline exports of natural gas in 2020.
- The building sector (residential and service sectors) representing 56% of the final gas consumption in 2018.
- EnerBlue provides an outlook on the energy system based on the successful achievement of the 2030 NDC targets (3-4°C scenario).
- Respective LNG liquefaction capacity of 117 bcm, 104 bcm and 46 bcm end of 2018.
- For electricity production, new gas plants generally emit half as much CO2 as coal power plants.