What is the reality of the transition to alternative fuels in transport?
This month, we examine the energy transition in the transport sector, including which technologies are at the forefront and which countries are leading the way. This brief is by Enerdata’s Scientific Director and Co-Founder Bruno Lapillonne.
One of the great challenges of the energy transition1 in transport is to shift the use of oil products (mainly gasoline and diesel) to alternative fuels.
These alternative fuels can be either decarbonized energy sources (such as biofuels) or energies with a lower carbon content (such as electricity2 and, to some extent, natural gas) which also significantly reduce emissions of local pollutants3.
In Some Countries, the Transition is Already Visible
Among G20 countries, Brazil and Argentina are by far the most advanced in terms of penetration of alternative fuels in the transport sector4, with more than 20% of the energy used in transport coming from alternative fuels.
They are followed by China, France and the UK, with around 10%, as shown in Figure 1. Some countries outside the G20 have made very good progress, especially Sweden (the front runner), and to a lesser extent, Thailand, Iran, Peru, Singapore and Norway. These are also generally the countries with the strongest progression of alternative fuels (+20 percentage points for Sweden from 2000 to 2017, +16 for Thailand and Iran).
In Brazil, Argentina, France, the UK and China, the transition has been generally slower than in these leading countries (+10 points since 2000 for most of them).
At the global level, the progression is slow and alternative fuels represent only 6% of transport consumption (+4 points since 2000).
Figure 1: Several Countries Show Major Progress in the Share of Alternative Fuels in Transport
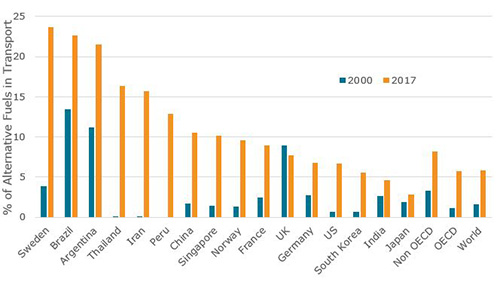
Source: Enerdata, Global Energy & CO2 Data
Natural gas has a high market share in Iran (16%), Argentina(13%) and Thailand (10%). Its purpose is mainly to diversify supply and reduce dependence on oil. This is probably not the best strategy for a transition to low-carbon fuels, unless an increasing share of this gas is renewable, as is planned in some countries.
Sweden and Brazil Lead Transport Decarbonisation
If we exclude natural gas, the leaders are Sweden and Brazil, with a share of biofuels slightly above 20%. They are followed by Norway, with around 10%. Additionally, Sweden and Norway both have almost completely decarbonized electricity mixes (98% as of 20175).
As shown in Figure 2, Singapore is the world leader for the electrification of transport, thanks to a high share of rail transport. But the country is still far from achieving a decarbonized power mix – standing at only 3% decarbonized as of 2017.
Figure 2: Biofuels Advancing More Significantly Than Electricity in Transport6
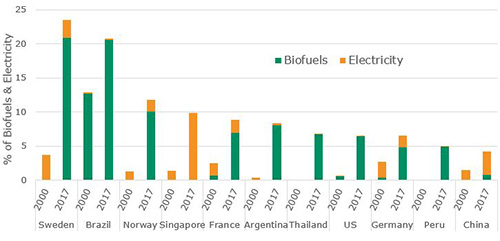
Source: Enerdata, Global Energy & CO2 Data
What About E-Mobility?
In the long-term, the progressive decarbonisation of the electricity supply, as planned in most G20 countries, makes simply raising the penetration of electricity in transport an attractive solution. However, progress thus far has been minimal in all but a few countries. Overall, the electrification of transport is hardly noteworthy.
However, in the medium-term more progress is expected thanks to the penetration of electric road vehicles (mainly light vehicles). Progress is also expected in the realm of public transport, but mostly in the longer term due to the huge investments involved.
Although the penetration of electric vehicles is still low (generally below 0.5%)7 , it is advancing rapidly in some countries.
The share of electric cars in new registrations doubled in China, the US and the EU in 2018. (From 2.7% in 2017 to 4.5% in 2018 in China, and from 1% to 2% in the US and in the EU, according to CAM8). Norway stands out with almost 50% of new cars registered in 2018 being electric cars (of which, 63% are battery powered and 37% are plug-in hybrids). China aims to lead the market for electric vehicles with a target of 45% of vehicle sales being electric9 by 2030, as laid out in the Made in China 2025 plan10.
According to EnerFuture projections from Enerdata, the share of decarbonized fuel (i.e. biofuels and decarbonized electricity) in transport could reach 26% in 2040 at the world level in a voluntarist scenario (Enerdata’s EnerGreen Scenario11, which represents the best-case scenario for decarbonisation), albeit with quite contrasting levels of adoption among countries. As shown in Figure 3, the projected share of total decarbonized fuels varies: 36% in the EU, 30% in the US and only 20% in China. The gap between China and the US is mainly due to stronger projections for biofuel adoption in the US. While the EU is expected to keep pace with the US on biofuels, greater decarbonisation of electricity will allow the EU to take the lead overall.
Figure 3: An “EnerGreen” Future – Decarbonisation of Transport Improving by 2040, But Not Uniformly
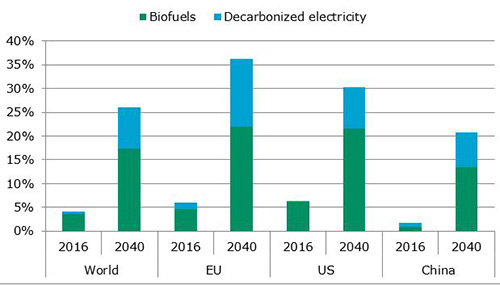
Source: Enerdata, POLES Model, EnerFuture (EnerBlue Scenario), January 2019
Footnotes:
- This brief addresses just one dimension of the transition to decarbonized transport: The fuel mix. The other areas that are equally important include improving the energy efficiency of transport modes, modal shift and decreasing mobility.
- The carbon content of electricity depends on the share of decarbonized sources (renewables or nuclear) in the power mix.
- All market shares are obtained from Enerdata’s Global Energy & CO2 Data; they are based on historical data from a combination of sources for 2017 including IEA, Eurostat and national sources.
- Transport here includes road and rail, as well as domestic air and water transport, following international definitions.
- China, which is second to Singapore in terms of electrification of transport, has an electricity mix with a high carbon content (only 30% decarbonized sources).
- This graph shows only selected countries with a high share of alternative fuels.
- In EU countries and the US, the share of electric cars is around 0.3% of the stock of cars; it is around 0.5% in China.
- Source of data on the share of electric cars among new registrations: Prof. Dr. Stefan Bratzel, E-Mobility 2019, CAM, Centre of Auto Management, January 2019.
- Including hybrid plug-in, electric and hydrogen vehicles (cars, light duty vehicles and buses).
- Source: Jincheng Ni, France Stratégie, Note d’analyse n°70, September 2018. (In French.)
- The EnerGreen Scenario assumes more stringent climate policies and the fulfillment of NDC objectives for 2030, and ambitious targets thereafter, to limit global temperature rise to 2°C.