See also
Energy system costs: an analysis based on the EnerFuture scenarios
Get this executive brief in pdf format (free)
Successfully reaching our climate objectives requires significant changes in our energy systems, across the whole value chain: reduction of energy consumption, decarbonisation of supply, deployment of clean technologies, etc. These profound changes in the way we consume and produce energy have massive impacts in terms of costs of the energy systems. This analysis builds upon Enerdata’s EnerFuture scenarios to provide quantitative insights into the expected trends in energy system costs in the context of different climate ambition levels.
Methodology and global trends
This analysis is based on our 3 energy-climate scenarios, annually updated and derived from our EnerFuture information service. These represent contrasted, plausible futures for energy systems:
- The EnerBase scenario is a Business-As-Usual trajectory, corresponding to the continuation of historical trends with limited climate ambition.
- The EnerBlue scenario accounts for stated policies and announced objectives from countries, and notably NDCs.
- The EnerGreen scenario is compatible with a temperature increase of well below 2°C, therefore aligned with the Paris agreement goals.
Figure 1 below gives a more comprehensive definition of the EnerFuture scenarios. The analysis presented in this brief evaluates the respective impacts of the scenarios in terms of costs for the energy systems.
Figure 1: Definition of the 3 EnerFuture scenarios
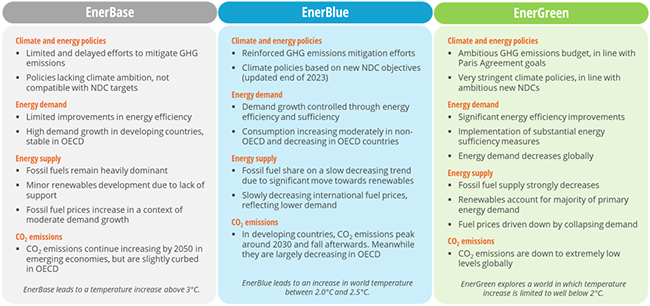
Source: Enerdata - EnerFuture
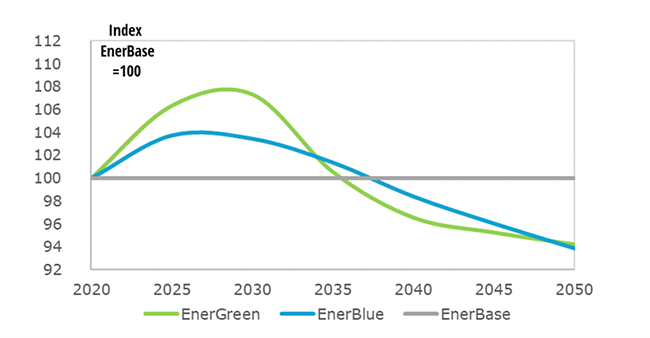
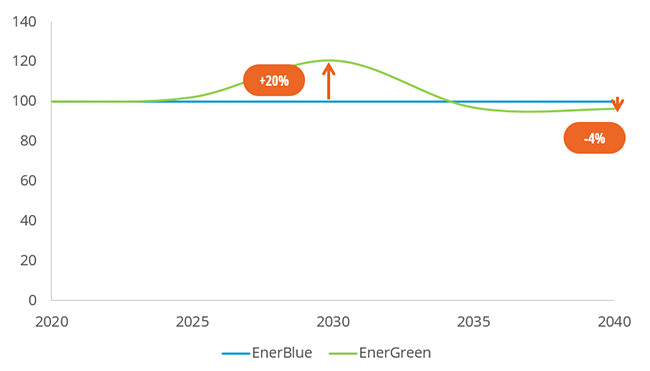
As expected, the increased efforts towards mitigation of greenhouse gas emissions in the EnerBlue and EnerGreen scenarios, as opposed to the EnerBase reference, imply additional costs for the energy systems. Figure 2 shows the difference in energy system costs across the scenarios, with EnerBase used as the reference index.
Significant additional costs are required in the short to medium term to support the transition: over 20% more in EnerGreen around 2030 vs EnerBase. Indeed, substantial investments in decarbonised technologies will need to be unlocked if countries want to align their emission pathways with Paris agreement-compatible trajectories.
However, the analysis also shows that such extra investments in the short term could pay off in the longer run. Indeed, the EnerGreen scenario becomes less costly than the reference after 2040, progressively offsetting the additional costs faced between today and then.
Figure 2: Additional global energy system costs in EnerBlue & EnerGreen vs. EnerBase
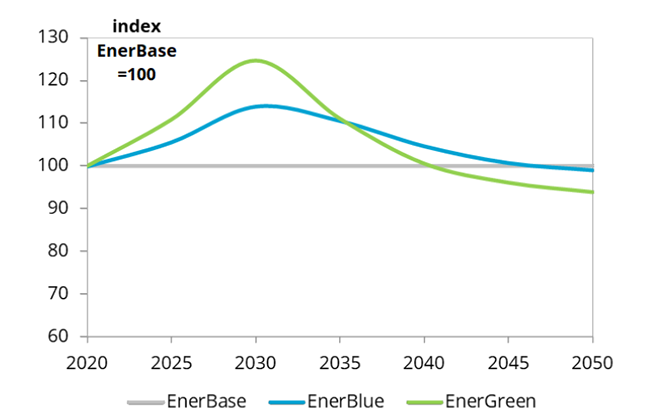
Source: Enerdata - EnerFuture
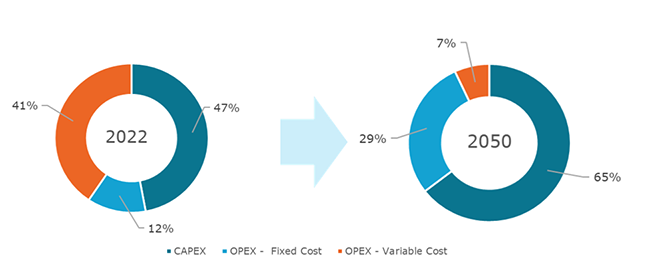
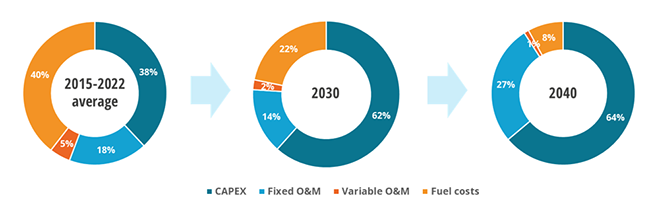
A deeper look into the structure of energy system costs in EnerGreen, as shown in Figure, provides a first explanation for this observation. The energy systems shift from a dominance of variable OPEX (and of fossil fuel costs in particular) towards a more CAPEX-oriented structure. The transition indeed requires significant short-term investment in decarbonisation technologies, which are typically CAPEX-intensive but do not necessarily require as much fuel costs to operate. This explains EnerGreen’s system costs decrease at the end of the horizon, compared to EnerBase.
Figure 3: Structure of energy system costs – World – EnerGreen
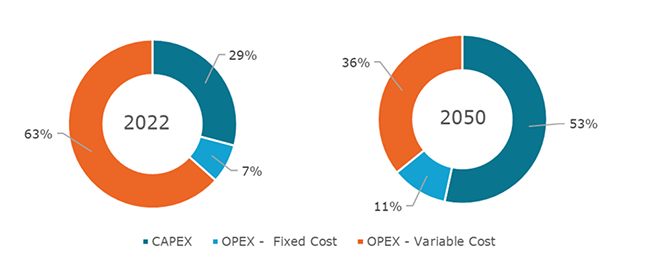
Source: Enerdata - EnerFuture
To analyse these trends with more concrete insights, the following sections present two case studies: the road transport sector and the power generation sector.
Road transport costs and the impact of electric vehicles
The following analysis is focused on the road component of the transportation sector. In road transport, CAPEX includes the costs of the fleet renewal for both passengers and freight transport, as well as the costs of charging stations for electric vehicles. OPEX is split into two main components: fixed operation and maintenance costs, and variable costs of fuels.
A drastic increase of transport costs at a global scale
One notable point to emphasise is the considerable rise in total transportation costs in all three scenarios during the whole simulation period: +83% in EnerGreen, +94% in EnerBlue and +106% in EnerBase between 2022 and 2050. In the short term, the two decarbonisation scenarios require additional investments, leading to higher costs than in EnerBase. After 2035, the trends reverse, EnerBlue and EnerGreen becoming more profitable, as shown in Figure 4.
Figure 4 : Additional transport costs in EnerBlue & EnerGreen vs. EnerBase - World
Source: Enerdata - EnerFuture
Global dynamics in EnerGreen
Diving into the EnerGreen scenario more particularly, still at a global scale, a change from a roughly balanced OPEX/CAPEX structure to a largely CAPEX-oriented one is noteworthy, as can be seen on Figure 5.
Figure 5: Cost structure of the road transport sector - EnerGreen
Source: Enerdata - EnerFuture
However, in absolute terms, the variable OPEX remains quite constant over the period, hence the significant increase in the total costs mentioned before, that is clearly carried out by a drastic rise in CAPEX.
Geographical comparison – a closer look at Europe and Asia in EnerGreen
While the global transport dynamics seems relatively similar to those of other sectors, discrepancies still appear across the world’s regions, as can be seen on Figure 6.
In Europe1, the changes in both the evolution trends and the structure of transport costs reflect the rapid development of electric vehicles (EV). Indeed, until 2035, the share of EV in the car fleet increases linearly from 1% in 2022 to nearly 50%2. This leads to a sharp increase in CAPEX during this first part of the simulation period (+43% over 2022-2035), EV remaining more expensive than thermal vehicles, while the total number of cars in circulation remains roughly stable (-4%). After 2035, and with the European ban on the sale of internal combustion engine vehicles3, the number of thermal cars drops, replaced by EV, which become therefore more competitive.
The EV development within the car fleet leads to a significant reduction of fuel costs as well: it reaches -61% over the whole simulation period.
Figure 6: Costs of the road transport sector in Europe (left) and Asia (right) – EnerGreen
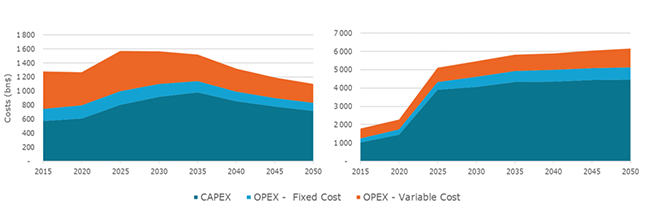
Source: Enerdata - EnerFuture
On the other hand, in some regions of the world, such as in Asia4, the trends observed are very different. Although the cost structure becomes more and more CAPEX-oriented throughout the simulation period, total costs more than double between 2022 and 2050. The growing weight of Asia – and notably China – in the global economy, combined to this important increase, is the main reason for the global cost rise observed in the transport sector.
Just like in Europe, the number of electric vehicles in Asia skyrockets (multiplication by almost 30 over the period). The major difference between the two regions lies in the fact that, contrary to Europe, the number of conventional cars in Asia continues to increase as well, until 2030. In 2050, conventional cars still represent more than 12% of the total stock, which almost triples between 2022 and 2050, therefore explaining a major part of the cost increase.
Power sector, renewables and return on investment
In this section, total costs expressed for the power generation sector explicitly account for investments in new power generation capacities, as well as maintenance and operating costs of existing and new production facilities. They do not relate to costs occurring in the power transmission and distribution networks, are therefore not included in the present analysis.
The impact of renewables on the power sector costs
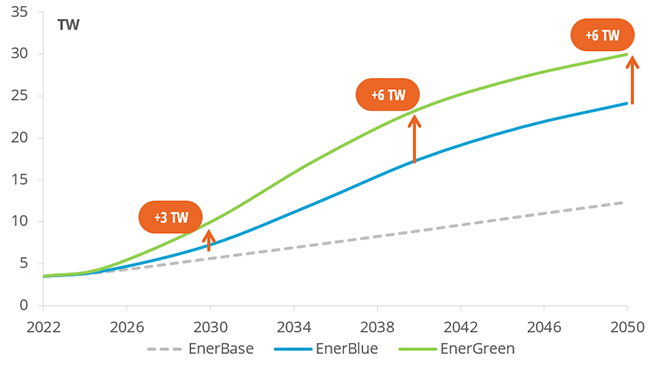
Renewables are among the key technologies to decarbonise the economy, and notably the power generation sector. At COP28, more than 120 countries have pledged to triple the global renewable electricity capacity to reach 11 TW by 2030. This objective is aligned with the Paris Agreement goals, and consistent with the results from our EnerGreen scenario, which are illustrated in Figure 7. Efforts currently announced by countries, accounted for in the EnerBlue scenario, are not sufficient yet to match this ambitious target, and lead to 8 TW in 2030, hence lagging 3 TW behind the objective. The gap between EnerBlue and EnerGreen keeps increasing by 2040 to reach 6 TW of renewable capacity, and then remains stable until 2050.
Figure 7: Renewable electricity capacity – World
Source: Enerdata - EnerFuture
The necessary renewable energy capacity additions in the EnerGreen scenario, compared to the currently announced ambition of countries in EnerBlue, would require significant additional investments in the short term to 2030, leading to an increase in total costs of the electricity generation sector, by around 20% more in 2030 in EnerGreen vs EnerBlue, as shown on Figure 8 below.
However, the additional investments will start to pay off after 2035, with total costs of the power sector declining in EnerGreen below the EnerBlue reference. In other words, the upfront additional investments will progressively allow for sustained cost savings, expected to end up compensating for the initial investments.
Figure 8: Additional costs in the power sector – World – EnerGreen vs EnerBlue
Source: Enerdata - EnerFuture
Again, this conclusion is mostly explained by the major shift occurring in the cost structure of power systems. Indeed, renewable energy sources are CAPEX-intensive technologies, compared to conventional power plants, such as gas-fired capacities: they suppose a significant initial investment, while they generally do not require paying for any fuel (except for biomass-fired plants).
Figure 9: Evolution of the power sector cost structure in % – World – EnerGreen
Source: Enerdata - EnerFuture
Today, fuel costs account for 40% of total costs in the power generation system, and fixed cost (CAPEX and fixed operation & maintenance costs) for 55% (Figure 9). In the EnerGreen scenario, where renewables dominate the power system by 2040, this picture is quickly transformed, and the weight of fuel costs decreases to as low as 8% in 2040. On the other hand, fixed cost account for 91% of the total (64% for CAPEX only).
Study on the impact of discount rate
Renewables being heavily reliant on CAPEX, and at the same time highly necessary technologies to decarbonise the economy, this raises the question of the cost of capital for these technologies. Indeed, if the regulatory and economic framework for investment in these technologies is favourable, hence helping reduce the associated risk, we could imagine lower rates of cost of capital for renewables, which would substantially enhance their development speed.
Figure 10: Impact of lower cost of capital on renewable electricity capacity – World
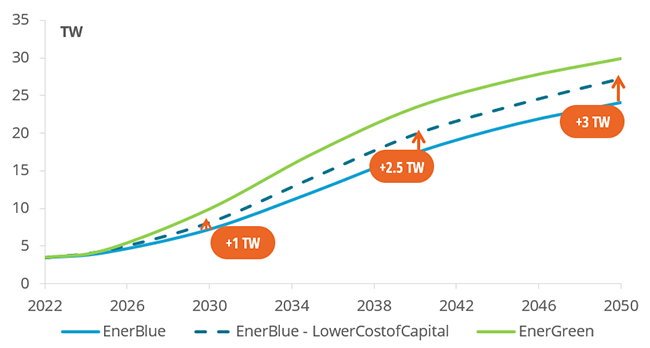
Source: Enerdata - EnerFuture
Figure 10 shows the results from a sensitivity scenario, based on EnerBlue, with as sole difference the reduction of the cost of capital for renewable electricity technologies by a factor 2. The impacts are significant, with 1 extra TW in 2030 and up to 3 TW in 2050 of additional renewable capacity at world level. This corresponds to around half of the difference between the EnerBlue and EnerGreen scenarios.
In other words, setting up a policy and regulatory framework with limited risk for renewable energy investment could help to reach up to half of the gap between the currently announced ambition and a Paris agreement-compatible trajectory.
Conclusion
The present analysis explores the underlying costs of the 3 EnerFuture contrasted energy-climate scenarios. Our findings show a strong need for additional short-term investments in order to engage the energy transition. However, these additional investments would tend to compensate in the longer term, with climate ambitious scenarios ending with lower total system costs after 2040 than in a Business-As-Usual trajectory.
Indeed, decarbonisation technologies are generally heavily relying on initial investment, but enable to decrease operating costs, in particular by limiting the dependency on fossil fuels and their associated costs. The deployment of electric vehicles in the road transport sector, and of renewable energy sources in the power sector, are two major game-changers in that regard.
The analysis also underlines the need for a favorable framework for investment in clean technologies, since limiting the cost of capital for such CAPEX-intensive technologies would enable to significantly accelerate their deployment. This could be achieved through the development of credible and transparent long-term strategies at country level, supported by adequate policy instruments reducing the investor risk for decarbonisation technologies, such as Contracts for Difference (CfDs) for renewable energies.
Notes:
- Analysis conducted on 32 countries and aggregates in Europe
- More information on EV deployment in Europe in Enerdata’s executive brief “Electric Vehicles’ deployment: will it reach expected target?” from April 2024. https://www.enerdata.net/publications/executive-briefing/electric-vehicles-trends.html
- Measure proposed within the Fit for 55 package, and adopted by the European Parliament in February 2023.
- Analysis conducted on 10 countries and aggregates in Asia, including China and India