New increase in LNG supply capacity and in LNG trade (+10%) in 2017
In 2017, global LNG imports surged by more than 25 Mt – i.e. +10% and twice the 2016 increase – reaching 280 Mt, in line with the development of new LNG capacities. After a record in yearly installations in 2016 (+33 Mt/year), global liquefaction capacity rose again in 2017, increasing by more than 28 Mt/year to 376 Mt/year.
As in 2016, most of the capacity addition occurred in Australia (+23 Mt in 2016 and +9.6 Mt/year in 2017), and in the United States (+9 Mt/year in 2017 as in 2016). New capacities were also commissioned in Malaysia (+4.8 Mt/year, including the first floating LNG (FLNG) plant in the world) and in Russia (+5.5 Mt/year).
Figure 1: New liquefaction capacities added in 2016 and 2017
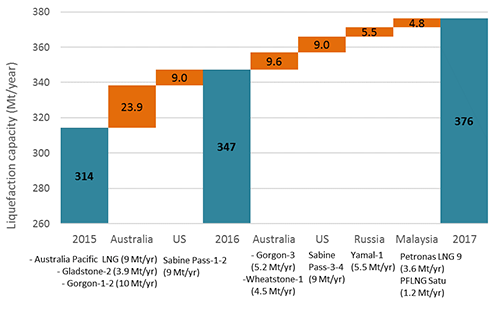
Source: Enerdata - World LNG Database
With these new capacities added in 2016 and 2017, Australia and the United States accounted for most of the increase in global LNG production (+25 Mt), with +9.9 Mt and +9.5 Mt respectively. New capacities also raised LNG production in Malaysia, while improved performance in LNG plants spurred production in Angola (fourfold increase after years of setbacks), in Nigeria and in Algeria. On the contrary, planned and unplanned maintenance in Qatar cut production by 3% (-2.5 Mt).
Strong demand absorbed additional production volumes and avoided LNG supply glut
Despite this massive LNG supply additions, there were no oversupply and no fall in prices on the global LNG market, as demand remained sustained. LNG imports rose by more than 10% in Asia, spurred by the Chinese gas demand and by a higher demand from the power sector in South Korea and Japan (low availability of nuclear power plants and cold weather). Chinese gas demand continued to soar in line with the economic growth and coal-to-gas substitution policies and the rise in LNG imports accelerated in 2017 (+42% in 2017 to 33 Mt, compared with +23% in 2016). China came nearly on par with South Korea (37 Mt, +12% in 2017), the second largest LNG importer behind Japan (stable at nearly 87 Mt). Higher oil-indexed and spot prices slowed down the growth in LNG imports from India (+6% after +25% in 2016), but imports soared in Pakistan (+56%), in Taiwan (+10%), in Thailand (+31%) and in Malaysia (+20%).
LNG imports also grew in Europe (+7.1 Mt, +17%), where the sole LNG import terminal was commissioned in 2017 (Malta). Imports rose especially in southern Europe (+32% in France, +33% in Spain, +20% in Italy), in a context of warm summer, low hydropower availability and low nuclear power generation. On the contrary, LNG imports fell by 35% in the United Kingdom against a sharp competition from renewables in the power sector and lower supply from Qatar.
Figure 2: Top ten LNG exporters and importers (Mt/year)
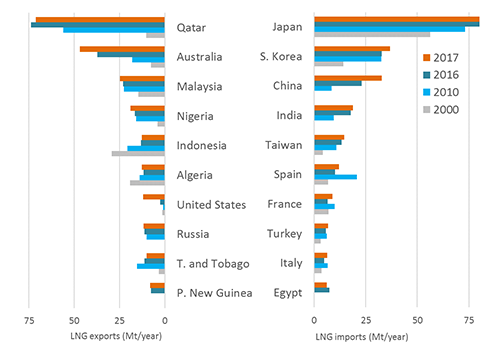
Source: Enerdata - World LNG Database
Imports fell by 7% in the Middle East (-35% in the United Arab Emirates) as Qatar production declined. In Egypt, LNG imports decreased by 18% (-1.3 Mt) (after a 21-fold increase in imports between 2013 and 2016 to 7.4 Mt) as domestic gas production recovered. In Latin America, LNG imports were driven by Brazil (+33%) and Mexico (+10%, due to constraints on gas pipeline imports from the United States). LNG imports in Canada and the United States remained low in 2017, as both countries are developing domestic gas resources and planning large LNG export capacities.
Nearly 600 Mt/year of capacities announced in Canada and the United States… but only 80 Mt/year expected to be added by 2020
Indeed, Canada has plans for up to 260 Mt/year of new liquefaction capacity, of which only one small-scale unit (Tilbury) is under construction. Only 51 Mt/year of new projects have been approved, but uncertainties over future LNG demand, escalating development costs and environmental constraints may stall their development. Indeed, four Canadian LNG projects totalling 62 Mt/year (including Petronas’ 18 Mt/year Pacific NorthWest LNG project) were cancelled in 2017. As well, nearly 320 Mt/year of LNG projects have been announced in the United States (around 100 Mt/year approved), of which 46 Mt/year are under construction and should be commissioned by 2020. The US liquefaction capacity may then near 80 Mt/year in 2020, and the United States should become the third largest LNG producer worldwide.
Australia, which has 17 Mt/year under construction and expected in 2018 (plus 6 Mt/year approved), will overtake Qatar as the largest LNG producer as of 2018, but may be soon caught up by Qatar, which plans to add 23 Mt/year by 2023, and by Russia, which plans to add 71 Mt/year by 2025.
Figure 3: Existing and planned LNG production capacities (Mt/year)
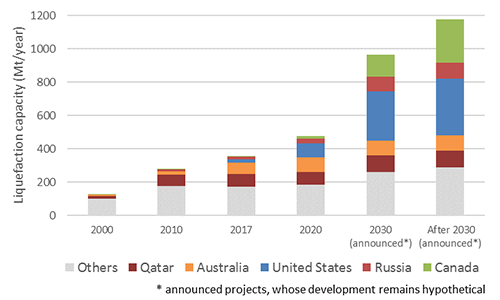
Source: Enerdata - World LNG Database
New LNG production from capacities under construction should be absorbed soon by the rising demand from Asia and Latin America. Despite all the announced projects – especially in the United States and Canada – few Final Investment Decisions (FIDs) have been made so far. Indeed, only one project, the 3.4 Mt/year Coral FLNG in Mozambique, was sanctioned in 2017 (two in 2016). The surging LNG demand from emerging markets could thus result in a global supply shortage in the early 2020s.