Venezuela Key Figures
- Population:
- 28.4 million
- GDP growth rate:
- 5.30 %/year
- Energy independence:
- 100%
Data of the last year available: 2024
- Total consumption/GDP:*
- 207 (2015=100)
- CO2 Emissions:
- 2.28 tCO2/cap
- Rate of T&D power losses:
- 20.5%
* at purchasing power parity
View all macro and energy indicators in the Venezuela energy report
Venezuela Energy News
View all news, archive your new and create your own daily newsletters only on your topics/countries of interest with Key Energy Intelligence
Venezuela Energy Research
- Venezuela's Energy & Climate Policy Framework: Venezuela's energy sector is dominated by oil, accounting for over 80% of exports and 15% of GDP. The country faces economic and political crises, with recent sanctions and reliance on China for financial support. Electricity and gas sectors are state-controlled, while oil policies favour state-run PDVSA. Energy efficiency measures and climate commitments are in place, though implementation remains challenging.
- Venezuela's Energy Companies: Venezuela's energy sector is state-controlled, with Corpoelec managing electricity and PDVSA overseeing oil and gas. PDVSA, facing financial challenges, dominates hydrocarbons, while international firms have largely exited due to sanctions.
- Venezuela's Energy Supply & Demand: Venezuela, despite holding the world's largest oil reserves, faces significant energy challenges due to economic and political crises. Primary energy consumption has rebounded since 2021 but remains 60% below its 2013 peak. Oil and gas dominate energy use, with hydroelectricity contributing 15%. Electricity generation is primarily hydro-powered, though production has fluctuated due to resource constraints. Oil production has partially recovered after a sharp decline, while natural gas production has rebounded but remains largely domestically consumed. The country's energy infrastructure, including transmission networks, has faced operational issues, and GHG emissions have varied with economic conditions.
- Venezuela's Energy Use & Price by Sector: "Final energy consumption rebounded post-2021 after a 2013-2020 decline. Government-controlled energy prices remain low, with oil dominating transport and gas leading in industry. Residential use relies heavily on electricity."
- Venezuela's Issues & Prospects: Venezuela's energy sector faces significant challenges due to economic and political crises, halting oil and gas projects. Electricity infrastructure requires urgent investment, with limited new capacity under development, primarily hydro and gas. Key projects include the Manuel Piar hydropower plant and the Dragon gas field, though progress is hindered by sanctions and financial constraints.
Benefit from up to 2 000 up-to-date data series for 186 countries in Global Energy & CO2 data
A data overview is available in the global energy statistics app
Venezuela Total Energy Production & Consumption
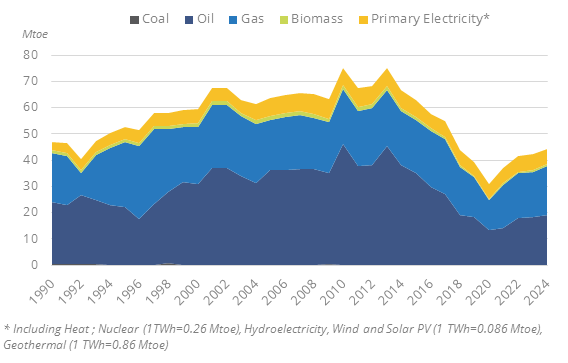
Due to deep political tensions and the economic crisis, the primary energy consumption in Venezuela fell drastically from 2013 to 2020, by about 12% per year on average, to a record-low of 31 Mtoe in 2020. Since 2021, it has grown by about 10% per year, reaching 44 Mtoein 2024, which is still around 60% below its peak at 75 Mtoe in 2013.
Graph: Primary Consumption Trends by Energy Source
Source: Venezuela energy report
Interactive Chart Venezuela Total Energy Production & Consumption
Source: Global Energy & CO2 data
Benefit from up to 2 000 up-to-date data series for 186 countries in Global Energy & CO2 data
View the detailed fondamentals of the market at country level (graphs, tables, analysis) in the Venezuela energy report
Venezuela Oil Production & Consumption
Crude oil production dropped by 77% between 2013 and 2020 and has increased by 9%/year since, reaching 53 Mt in 2024.
Approximately 2/3 of the oil production is exported. In addition, Venezuela exported 1 Mt of oil products in 2024.
Source: Venezuela energy report
Interactive Chart Venezuela Crude Oil Production & Consumption
Source: Global Energy & CO2 data
Interactive Chart Venezuela Refined Oil Products Production & Consumption
Source: Global Energy & CO2 data
Benefit from up to 2 000 up-to-date data series for 186 countries in Global Energy & CO2 data
Additionally, for more detailed information on refineries, you can request a sample of our America Refineries Dataset
Venezuela Natural Gas Production & Consumption
The natural gas production dropped by 47% from 2016 to 2020 and has since rebounded by 13%/year, reaching 23 bcm in 2024.
Only a quarter of the gas production is marketed; a strong proportion is re-injected (40%). That production is only used to supply the domestic market, with the largest part being used for the production of electricity and in industry.
Source: Venezuela energy report
Interactive Chart Venezuela Gas Production & Consumption
Source: Global Energy & CO2 data
Benefit from up to 2 000 up-to-date data series for 186 countries in Global Energy & CO2 data
Additionally, for more detailed information on the LNG trade, you can request a sample of our America LNG Trade Dataset
Venezuela Coal and Lignite Production & Consumption
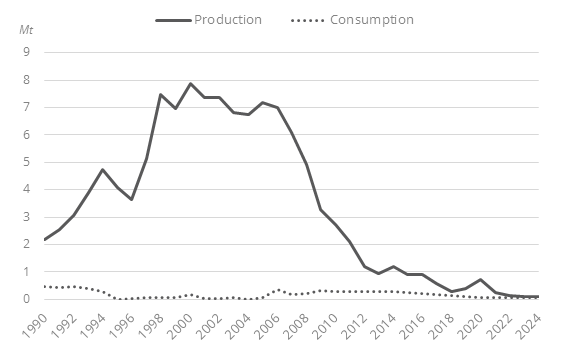
The production of coal has dropped dramatically since 2006 (0.1 Mt in 2024). It increased strongly between 1990 and 2000, from 2 Mt to 8 Mt, and then remained stable at around 7 Mt until 2006.
Graph: Coal Production & Consumption
Source: Venezuela energy report
Interactive Chart Venezuela Coal and Lignite Production & Consumption
Source: Global Energy & CO2 data
Benefit from up to 2 000 up-to-date data series for 186 countries in Global Energy & CO2 data
View the detailed consumption trends at country level (graphs, tables, analysis) in the Venezuela energy report
Venezuela GHG emissions and CO2 emissions
The updated NDC (2021) confirmed the objective set at COP21 in Paris (2015), to reduce GHG emissions by 20% by 2030 compared to a BAU projection.
Source: Venezuela energy report
Interactive Chart Venezuela CO2 emissions
Source: Global Energy & CO2 data
Benefit from up to 2 000 up-to-date data series for 186 countries in Global Energy & CO2 data
View the detailed consumption trends at country level (graphs, tables, analysis) in the Venezuela energy report