United Kingdom Key Figures
- Population:
- 69.2 million
- GDP growth rate:
- 1.10 %/year
- Energy independence:
- 61.6%
Data of the last year available: 2024
- Total consumption/GDP:*
- 71.5 (2015=100)
- CO2 Emissions:
- 4.05 tCO2/cap
- Rate of T&D power losses:
- 8.05%
* at purchasing power parity
View all macro and energy indicators in the United Kingdom energy report
United Kingdom Energy News
View all news, archive your new and create your own daily newsletters only on your topics/countries of interest with Key Energy Intelligence
United Kingdom Energy Research
- United Kingdom's Energy & Climate Policy Framework: The UK aims to cut GHG emissions by 81% by 2035 and achieve net-zero by 2050, phasing out coal and expanding renewables, nuclear, and carbon capture. Key policies include the Net Zero Strategy, Electricity Market Reform, and Contracts for Difference. The government also regulates energy markets through Ofgem and NESO, while post-Brexit energy trade deals with the EU are in place.
- United Kingdom's Energy Companies: EDF and RWE lead UK wholesale power, while Octopus Energy, British Gas, and E.ON dominate retail. The generation market is diversifying, with GBE investing in renewables. National Grid manages transmission, and eight operators oversee gas distribution. The UK's coal industry has ceased operations.
- United Kingdom's Energy Supply & Demand: The UK's energy mix has shifted significantly, with carbon-free generation rising to 66% in 2024. Energy consumption per capita has fallen by nearly a third since 2000, while natural gas and oil now dominate the energy supply. The UK has phased out coal, expanded wind and solar capacity, and increased electricity imports. GHG emissions have dropped by 54% since 1990, with energy-related CO2 emissions decreasing by 5% annually since 2021. The country aims for net-zero emissions by 2050.
- United Kingdom's Energy Use & Price by Sector: "Final energy consumption fell sharply from 2021 to 2023, stabilising in 2024. Oil and gas dominated (70%), with electricity at 21%. Household gas prices dropped 32% in 2024 after a 70% surge in 2022. Industrial electricity prices doubled since 2021, remaining stable in 2024. Transport relied on oil (91%), while residential use saw gas decrease to 52% and electricity rise to 32%."
- United Kingdom's Issues & Prospects: The UK aims to boost offshore wind to 50 GW by 2030 and triple nuclear capacity by 2050. The Sixth Carbon Budget targets a 6.1% annual GHG reduction from 2020-2035. NESO advises doubling onshore wind and tripling solar capacity by 2030, alongside accelerating grid expansion. Electricity demand is projected to grow by 2.7% annually until 2035. Significant investments are planned in nuclear, gas, hydropower, solar, wind, wave, biomass, transmission, and storage projects to support these targets.
Benefit from up to 2 000 up-to-date data series for 186 countries in Global Energy & CO2 data
A data overview is available in the global energy statistics app
United Kingdom Total Energy Production & Consumption
Consumption per capita has shrunk by almost a third since 2000, bringing it to 2.1 toein 2024.
In 2023, energy consumption at normal climate decreased by 1% in 2024 to 145 Mtoe, after a sharp reduction from 2021 to 2023 (-5%/year). In 2021, consumption increased by 3% after an 8% drop in 2020. Previously, between 2003 and 2019, energy consumption at normal climate decreased by almost 2%/year.
Graph: Primary Consumption Trends by Energy Source
Source: United Kingdom energy report
Interactive Chart United Kingdom Total Energy Production & Consumption
Source: Global Energy & CO2 data
Benefit from up to 2 000 up-to-date data series for 186 countries in Global Energy & CO2 data
View the detailed fondamentals of the market at country level (graphs, tables, analysis) in the United Kingdom energy report
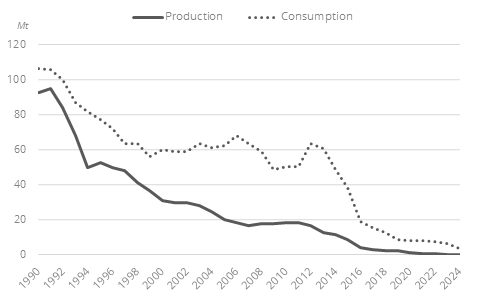
United Kingdom Oil Production & Consumption
Since 2019, production has declined by 10%/year, reaching 31 Mt in 2024 (-9% in 2024). Previously, it rebounded by 5.5%/year between 2014 and 2019 from 40 Mt to 53 Mt. Over 1999-2014, oil production decreased by 8%/year from a peak of 137 Mt to 40 Mt.
The UK became a net crude oil importer in 2005 (18 Mt of net imports in 2023).
Source: United Kingdom energy report
Interactive Chart United Kingdom Crude Oil Production & Consumption
Source: Global Energy & CO2 data
Interactive Chart United Kingdom Refined Oil Products Production & Consumption
Source: Global Energy & CO2 data
Benefit from up to 2 000 up-to-date data series for 186 countries in Global Energy & CO2 data
Additionally, for more detailed information on refineries, you can request a sample of our EMEA Refineries Dataset
United Kingdom Natural Gas Production & Consumption
Gas production has shown strong fluctuations since 2020; it decreased by 10% in 2024 to 33 bcm, as in 2023, after a 16% increase in 2022 and an 18% decline in 2021. It was relatively stable between 2012 and 2020 at around 40 bcm/year. Previously, gas production decreased by almost 70% from a peak at 115 bcm in 2000 to 40 bcm in 2013.
The country has been a net importer of gas since 2004. Net imports decreased by 10%/year from 2022 to 2024 to 43 bcm, following a 20% decrease in 2022. Between 2010 and 2020, they decreased by 2%/year, reaching 45 Mt in 2020.
Source: United Kingdom energy report
Interactive Chart United Kingdom Gas Production & Consumption
Source: Global Energy & CO2 data
Benefit from up to 2 000 up-to-date data series for 186 countries in Global Energy & CO2 data
Additionally, for more detailed information on the LNG trade, you can request a sample of our EMEA LNG Trade Dataset
United Kingdom Coal and Lignite Production & Consumption
Coal production virtually stopped in 2024, after a sharp decrease since 2011 (25%/year). Deep mined coal production ceased in 2016.
Coal consumption has been decreasing since 2009 (-92% or -15%/year), reaching 3.6 Mtin 2024.
Coal imports have been decreasing sharply since a peak at 51 Mt in 2013 to 5 Mt in 2023 and 3 Mt in 2024 with the closure of several coal-fired power plants.
Graph: Coal Production & Consumption
Source: United Kingdom energy report
Interactive Chart United Kingdom Coal and Lignite Production & Consumption
Source: Global Energy & CO2 data
Benefit from up to 2 000 up-to-date data series for 186 countries in Global Energy & CO2 data
View the detailed consumption trends at country level (graphs, tables, analysis) in the United Kingdom energy report
United Kingdom Renewable in % Electricity Production
In 2023, the government committed to fully decarbonise the power system by 2035. This commitment includes the development of up to 50 GW of offshore wind by 2030 (5 GW of which is floating offshore wind) (16 GW end of 2024). Previously, the National Infrastructure Commission (NIC, 2020) updated its target for deployment of renewables, from 50% to 65% of the power mix by 2030 (52% in 2024).
The target of 20 GW of solar in 2020 set in the Solar Strategy of 2014 was not reached (14 GW end of 2020 and 17.5 GW end of 2024).
Source: United Kingdom energy report
Interactive Chart United Kingdom Share of Renewables in Electricity Production (incl hydro)
Source: Global Energy & CO2 data
Benefit from up to 2 000 up-to-date data series for 186 countries in Global Energy & CO2 data
Learn more about renewables in the European Battery Market Analysis
United Kingdom GHG emissions and CO2 emissions
In its updated NDC (2022), the country aims to reduce its GHG emissions by 68% by 2030 from 1990 levels, compared to 53% in the 2020 NDC. The 2025 NDC included the target to reduce GHG emissions by 81% by 2035 (compared to 1990 levels), enhancing the previous 78% target set into the 2021 law.
In 2019, the United Kingdom adopted a law requiring net-zero GHG emissions by 2050.
In 2018, the Scottish Government unveiled an ambitious climate change plan targeting a 66% cut in GHG emissions by 2032, compared to 1990 (59% achieved in 2021).
Source: United Kingdom energy report
Interactive Chart United Kingdom CO2 emissions
Source: Global Energy & CO2 data
Benefit from up to 2 000 up-to-date data series for 186 countries in Global Energy & CO2 data
View the detailed consumption trends at country level (graphs, tables, analysis) in the United Kingdom energy report