United Kingdom Key Figures
- Population:
- 69.4 million
- GDP growth rate:
- 1.32 %/year
- Energy independence:
- 60.7%
Data of the last year available: 2025
- Total consumption/GDP:*
- 70.0 (2015=100)
- CO2 Emissions:
- 4.00 tCO2/cap
- Rate of T&D power losses:
- 9.20%
* at purchasing power parity
View all macro and energy indicators in the United Kingdom energy report
United Kingdom Energy News
View all news, archive your new and create your own daily newsletters only on your topics/countries of interest with Key Energy Intelligence
United Kingdom Energy Research
- United Kingdom's Energy & Climate Policy Framework: UK energy & climate policy aims for 81% GHG cuts by 2035, net-zero by 2050, via renewables, nuclear, and CCUS, with £40bn annual investment.
- United Kingdom's Energy Companies: UK energy market overview: EDF & RWE lead wholesale power; Octopus, British Gas & E.ON dominate retail. GB Energy established to boost renewables. BP, TotalEnergies & Harbour Energy lead oil/gas production.
- United Kingdom's Energy Supply & Demand: UK’s energy mix now 67% carbon-free, with oil/gas dominant but declining; coal phased out.
- United Kingdom's Energy Use & Price by Sector: Final energy consumption stable since 2023; oil & gas dominate at 72%. Household gas prices fell 2% in 2025. Electricity share rising but remains below OECD average.
- United Kingdom's Issues & Prospects: UK targets 50GW offshore wind & triples nuclear by 2050, with major grid upgrades and carbon budget acceleration.
Benefit from up to 2 000 up-to-date data series for 186 countries in Global Energy & CO2 data
A data overview is available in the global energy statistics app
United Kingdom Total Energy Production & Consumption
In 2025, energy consumption at normal climate decreased by 1% to 144 Mtoe, after a sharp reduction from 2021 to 2023 (-5%/year). In 2021, consumption increased by 3% after an 8% drop in 2020. Previously, between 2003 and 2019, energy consumption at normal climate decreased by almost 2%/year. Consumption per capita reached 2.1 toe in 2025.
Graph: Primary Consumption Trends by Energy Source
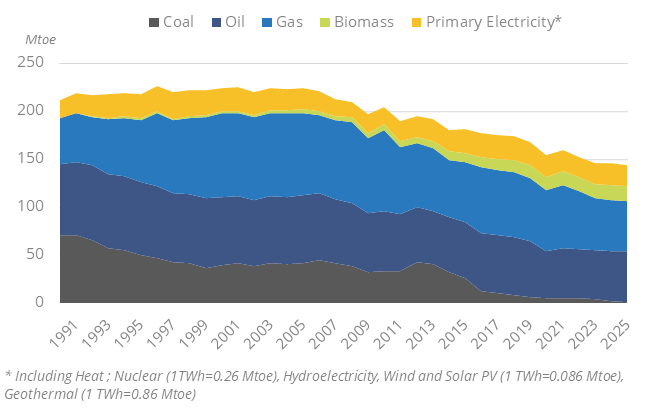
Source: United Kingdom energy report
Interactive Chart United Kingdom Total Energy Production & Consumption
Source: Global Energy & CO2 data
Benefit from up to 2 000 up-to-date data series for 186 countries in Global Energy & CO2 data
View the detailed fondamentals of the market at country level (graphs, tables, analysis) in the United Kingdom energy report
United Kingdom Oil Production & Consumption
From 2019 to 2024, production declined by 10%/year but increased by 2% in 2025 to 31 Mt. Previously, it rebounded by 5.5%/year between 2014 and 2019 from 40 Mt to 53 Mt. Over 1999-2014, oil production decreased by 8%/year from a peak of 137 Mt to 40 Mt.
The UK became a net crude oil importer in 2005 (16 Mt of net imports in 2025).
Source: United Kingdom energy report
Interactive Chart United Kingdom Crude Oil Production & Consumption
Source: Global Energy & CO2 data
Interactive Chart United Kingdom Refined Oil Products Production & Consumption
Source: Global Energy & CO2 data
Benefit from up to 2 000 up-to-date data series for 186 countries in Global Energy & CO2 data
Additionally, for more detailed information on refineries, you can request a sample of our EMEA Refineries Dataset
United Kingdom Natural Gas Production & Consumption
Gas production has decreased by 8%/year on average since 2022, reaching 32 bcm in 2025. In 2022, it increased by 16% following an 18% decline in 2021. It was relatively stable between 2012 and 2020 at around 40 bcm/year. Previously, it decreased by 70% from a peak at 115 bcm in 2000 to 40 bcm in 2013.
The country has been a net importer of gas since 2004. Net imports decreased by 13%/year from 2022 to 2025 to 44 bcm, following a 20% decrease in 2022. Between 2010 and 2020, they decreased by 2%/year, reaching 45 Mt in 2020.
Source: United Kingdom energy report
Interactive Chart United Kingdom Gas Production & Consumption
Source: Global Energy & CO2 data
Benefit from up to 2 000 up-to-date data series for 186 countries in Global Energy & CO2 data
Additionally, for more detailed information on the LNG trade, you can request a sample of our EMEA LNG Trade Dataset
United Kingdom Coal and Lignite Production & Consumption
Coal production virtually stopped in 2024, after a sharp decrease since 2011 (25%/year). Deep mined coal production ceased in 2016. Coal imports have been decreasing sharply since a peak at 51 Mt in 2013, reaching 5 Mt in 2023 and 3 Mt in 2024 with the closure of several coal-fired power plants. Coal consumption has been decreasing since 2009 (-92% or-15%/year), reaching 1.8 Mt in 2025. Most of the coal is used in industry (62%), the rest being used in coal transformations (12%), power generation (12%), and buildings (12%).
Graph: Coal Production & Consumption
Source: United Kingdom energy report
Interactive Chart United Kingdom Coal and Lignite Production & Consumption
Source: Global Energy & CO2 data
Benefit from up to 2 000 up-to-date data series for 186 countries in Global Energy & CO2 data
View the detailed consumption trends at country level (graphs, tables, analysis) in the United Kingdom energy report
United Kingdom Renewable in % Electricity Production
In April 2025, the government updated its Clean Power 2030 Action Plan, which aims at delivering 95% of electricity generation through clean sources in 2030. Building on the independent advice from NESO, the plan aims to install 43-50 GW of offshore wind capacity, 27-29 GW of onshore wind capacity, 45-47 GW of solar capacity, and 27 GW ofgrid-connected BESS capacity by 2030.
In 2023, the government committed to fully decarbonise the power system by 2035.
Source: United Kingdom energy report
Interactive Chart United Kingdom Share of Renewables in Electricity Production (incl hydro)
Source: Global Energy & CO2 data
Benefit from up to 2 000 up-to-date data series for 186 countries in Global Energy & CO2 data
Learn more about renewables in the European Battery Market Analysis
United Kingdom GHG emissions and CO2 emissions
The 2025 NDC included the target to reduce GHG emissions by 81% by 2035 (compared to 1990 levels), enhancing the previous 78% target set into the 2021 law. In its 2022 NDC, the country set a reduction target of 68% for 2030.
In 2019, the United Kingdom adopted a law requiring net-zero GHG emissions by 2050.
In 2018, the Scottish Government unveiled an ambitious climate change plan targeting a 66% cut in GHG emissions by 2032, compared to 1990 (59% achieved in 2021).
Source: United Kingdom energy report
Interactive Chart United Kingdom CO2 emissions
Source: Global Energy & CO2 data
Benefit from up to 2 000 up-to-date data series for 186 countries in Global Energy & CO2 data
View the detailed consumption trends at country level (graphs, tables, analysis) in the United Kingdom energy report