Ukraine Key Figures
- Population:
- 38.0 million
- GDP growth rate:
- -29 %/year
- Energy independence:
- 77.1%
Data of the last year available: 2022
- Total consumption/GDP:*
- 64.9 (2005=100)
- CO2 Emissions:
- 3.14 tCO2/capita
- Rate of T&D power losses:
- 10.9%
* at purchasing power parity
Ukraine Energy News
View all news, archive your new and create your own daily newsletters only on your topics/countries of interest with Key Energy Intelligence
Ukraine Energy Research
Benefit from up to 2 000 up-to-date data series for 186 countries in Global Energy & CO2 data
A data overview is available in the global energy statistics app
Ukraine Total Energy Production & Consumption
Ukraine's total energy consumption per capita fell from 4.9 toe in 1990 to 2.9 toe in 2010 and 2.1 toe in 2021. It even dropped by 19% in 2022 to 1.7 toe, which is 55% lower than the average for the EU.
Electricity consumption per capacity dropped by 21% in 2022 due to the Russian invasion and reached 2 246 kWh. Previously, it had been around 2 700 kWh starting in 2018, which was around half the electricity consumption compared to the EU.
Graph: CONSUMPTION TRENDS BY ENERGY SOURCE (Mtoe)
Source: Ukraine energy report
Interactive Chart Ukraine Total Energy Production & Consumption
Source: Global Energy & CO2 data
Benefit from up to 2 000 up-to-date data series for 186 countries in Global Energy & CO2 data
View the detailed fondamentals of the market at country level (graphs, tables, analysis) in the Ukraine energy report
Ukraine Oil Production & Consumption
Ukraine produced 2.2 Mt of crude oil in 2022 (-4%/year since 2019), covering around 76% of its consumption.
Source: Ukraine energy report
Interactive Chart Ukraine Crude Oil Production & Consumption
Source: Global Energy & CO2 data
Interactive Chart Ukraine Refined Oil Products Production & Consumption
Source: Global Energy & CO2 data
Benefit from up to 2 000 up-to-date data series for 186 countries in Global Energy & CO2 data
Additionally, for more detailed information on refineries, you can request a sample of our EMEA Refineries Dataset
Ukraine Natural Gas Production & Consumption
Natural gas consumption dropped by 25% in 2022 to 20.7 bcm. Over 2005-2021, it had decreased by 5.9%/year (-67%).
Graph: NATURAL GAS CONSUMPTION (bcm)
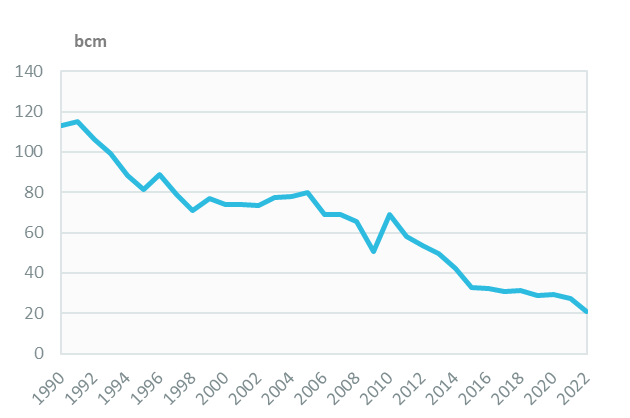
Source: Ukraine energy report
Interactive Chart Ukraine Gas Production & Consumption
Source: Global Energy & CO2 data
Benefit from up to 2 000 up-to-date data series for 186 countries in Global Energy & CO2 data
Additionally, for more detailed information on the LNG trade, you can request a sample of our EMEA LNG Trade Dataset
Ukraine Coal and Lignite Production & Consumption
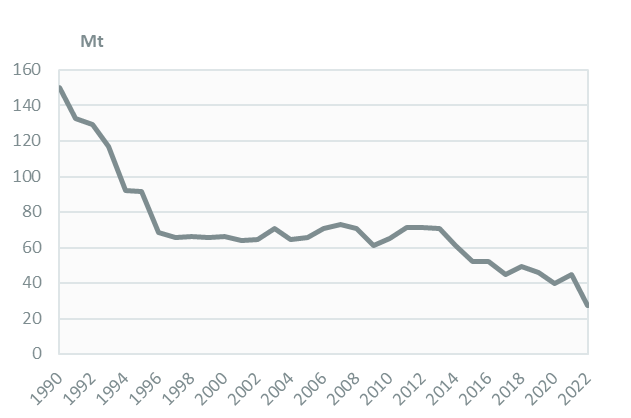
Coal consumption dropped by 40% in 2022 to 27 Mt. For 2012-2021, coal consumption declined by 5.9%/year (-44%) to 40 Mt in 2020, mainly due to the civil war that had disrupted coal supply.
Graph: COAL CONSUMPTION (Mt)
Coal is mainly used in power plants (53%, up from 43% in 2000) and industry (34%).
Graph: COAL CONSUMPTION BREAKDOWN BY SECTOR (2022, %)
Source: Ukraine energy report
Interactive Chart Ukraine Coal and Lignite Production & Consumption
Source: Global Energy & CO2 data
Benefit from up to 2 000 up-to-date data series for 186 countries in Global Energy & CO2 data
View the detailed consumption trends at country level (graphs, tables, analysis) in the Ukraine energy report
Ukraine Power Production & Consumption
Electricity consumption dropped by 32% in 2022 to 85 TWh due to energy infrastructure damages and the general collapse in electricity demand due to the Russian invasion. Previously, it had rebounded by 7% in 2021 to 125 TWh, after a decline of around 3%/year (-22%) between 2012 and 2020.
Graph: ELECTRICITY CONSUMPTION (TWh)
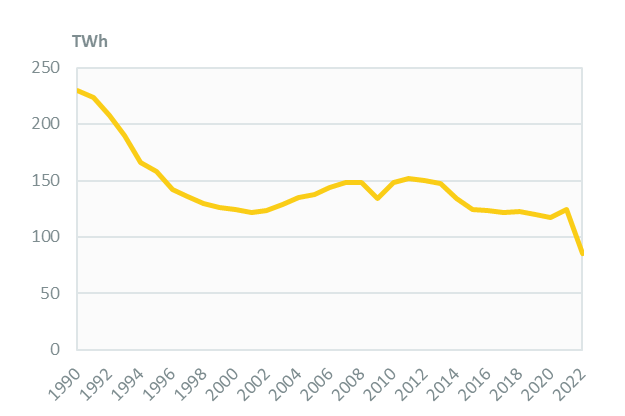
Source: Ukraine energy report
Interactive Chart Ukraine Power Production & Consumption
Source: Global Energy & CO2 data
Benefit from up to 2 000 up-to-date data series for 186 countries in Global Energy & CO2 data
View the detailed consumption trends at country level (graphs, tables, analysis) in the Ukraine energy report
Ukraine Renewable in % Electricity Production
SAEE is also in charge of implementing the policy on renewables and alternative fuels.
The target set by the National Renewable Energy Action Plan (NREAP, 2014) for a share of renewables of 11% of final energy consumption in 2020 (11% for electricity, 12.4% for heating, and 10% for transport) was missed by 2 pp (9.2%, including 13.9% for electricity, 9.3% for heating, and 2.5% in transport).
Source: Ukraine energy report
Interactive Chart Ukraine Share of Renewables in Electricity Production (incl hydro)
Source: Global Energy & CO2 data
Benefit from up to 2 000 up-to-date data series for 186 countries in Global Energy & CO2 data
Ukraine GHG emissions and CO2 emissions
In its updated NDC (2021), Ukraine committed to cut its GHG emissions by 65% by 2030 compared to 1990 levels (including LULUCF) and to reach carbon neutrality by 2060.
In 2021, Ukraine's GHG emissions (including LULUCF) reached 342 MtCO2eq, 63% lower than in 1990.
Source: Ukraine energy report
Interactive Chart Ukraine CO2 emissions
Source: Global Energy & CO2 data
Benefit from up to 2 000 up-to-date data series for 186 countries in Global Energy & CO2 data
View the detailed consumption trends at country level (graphs, tables, analysis) in the Ukraine energy report