Sweden Key Figures
- Population:
- 10.6 million
- GDP growth rate:
- 0.97 %/year
- Energy independence:
- 78.8%
Data of the last year available: 2024
- Total consumption/GDP:*
- 87.6 (2015=100)
- CO2 Emissions:
- 2.95 tCO2/cap
- Rate of T&D power losses:
- 6.92%
* at purchasing power parity
View all macro and energy indicators in the Sweden energy report
Sweden Energy News
View all news, archive your new and create your own daily newsletters only on your topics/countries of interest with Key Energy Intelligence
Sweden Energy Research
- Sweden's Energy & Climate Policy Framework: Sweden aims for 100% fossil-free power by 2040 and carbon neutrality by 2045, with high CO2 taxes and strong renewable energy policies. The government supports nuclear expansion and energy efficiency improvements, while regulating energy markets through various agencies.
- Sweden's Energy Companies: Sweden's energy sector is dominated by state-owned firms, with Vattenfall leading in carbon-free electricity generation. Key players include Uniper, Fortum, and Statkraft. Swedegas manages natural gas imports, while district heating is provided by over 700 companies.
- Sweden's Energy Supply & Demand: Sweden's energy mix is 93% carbon-free, with renewables at 70% (2024). It exports electricity but imports all oil and gas. Energy consumption rose 1.3% in 2024 to 45 Mtoe. Primary electricity and biomass dominate, while oil use declines. Sweden relies on hydro and wind power, with nuclear and solar expanding. It is a net electricity exporter, with high per capita consumption. Oil and gas are fully imported, and coal use is minimal. GHG emissions have fallen 53% since 1990, with energy-related CO₂ down 30% since 2010.
- Sweden's Energy Use & Price by Sector: Sweden's final energy consumption per capita is 70% above the EU average, with industrial electricity prices among the lowest in the EU. Final energy demand has remained stable since 2021, with industry, transport, and households/services/agriculture as the primary sectors. Electricity's share of total energy consumption is rising, while oil and biomass remain significant. Industrial energy prices fluctuate, with notable regional variations. Transport's energy demand has declined, primarily using oil, while residential and service sectors rely heavily on electricity and heat. Government interventions, such as tax cuts and subsidies, have influenced energy prices.
- Sweden's Issues & Prospects: Sweden is expanding its energy capacity with significant wind, nuclear, and hydropower projects, alongside green hydrogen initiatives, to meet rising electricity demand driven by electrification.
Benefit from up to 2 000 up-to-date data series for 186 countries in Global Energy & CO2 data
A data overview is available in the global energy statistics app
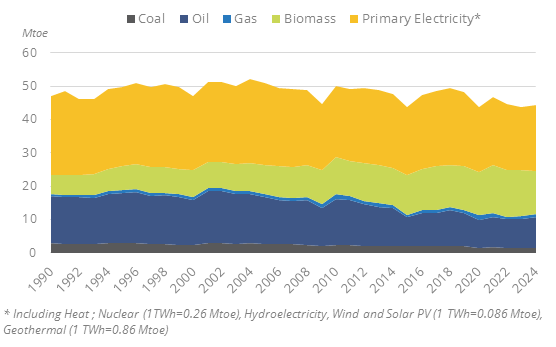
Sweden Total Energy Production & Consumption
Total energy consumption increased by 1.3% in 2024, reaching 45 Mtoe, after decreasing between 2021 and 2023 (-1.4%/year). Between 2000 and 2020, it oscillated between 44 Mtoe and 52 Mtoe, following economic fluctuations.
Graph: Primary Consumption Trends by Energy Source
Source: Sweden energy report
Interactive Chart Sweden Total Energy Production & Consumption
Source: Global Energy & CO2 data
Benefit from up to 2 000 up-to-date data series for 186 countries in Global Energy & CO2 data
View the detailed fondamentals of the market at country level (graphs, tables, analysis) in the Sweden energy report
Sweden Oil Production & Consumption
Sweden does not produce oil. In 2024, Sweden imported around 19 Mt of crude oil. Crude oil consumption fluctuates around 20 Mt, between 18 Mt and 22 Mt (21 Mt 2024).
The country has a refining capacity of 454 kb/d distributed over five refineries and is a net exporter of refined products (around 14 Mt in 2024). It has a total oil storage capacity of 95 kb distributed over about 30 storage facilities across the country (of which around 73 kb for refined oil products and 22 kb for crude oil).
Graph: Crude Oil Production & Consumption
Source: Sweden energy report
Interactive Chart Sweden Crude Oil Production & Consumption
Source: Global Energy & CO2 data
Interactive Chart Sweden Refined Oil Products Production & Consumption
Source: Global Energy & CO2 data
Benefit from up to 2 000 up-to-date data series for 186 countries in Global Energy & CO2 data
Additionally, for more detailed information on refineries, you can request a sample of our EMEA Refineries Dataset
Sweden Natural Gas Production & Consumption
Sweden does not produce natural gas; gas is imported by pipe from Denmark, from the Tyra Field in the North Sea, and as LNG. Gas imports fluctuated around 1 bcm between 2012 and 2019 and decreased by 50% between 2020 and 2022; they increased by 13% in 2023 to 0.8 bcm and by 8% in 2024 to 0.9 bcm. Most of the gas is imported by pipe (80% in 2024). The 10 bcm/year Baltic Pipe connecting Sweden, Norway, and Denmark started operating in 2022.
Source: Sweden energy report
Interactive Chart Sweden Gas Production & Consumption
Source: Global Energy & CO2 data
Benefit from up to 2 000 up-to-date data series for 186 countries in Global Energy & CO2 data
Additionally, for more detailed information on the LNG trade, you can request a sample of our EMEA LNG Trade Dataset
Sweden Coal and Lignite Production & Consumption
Graph: Coal Production & Consumption
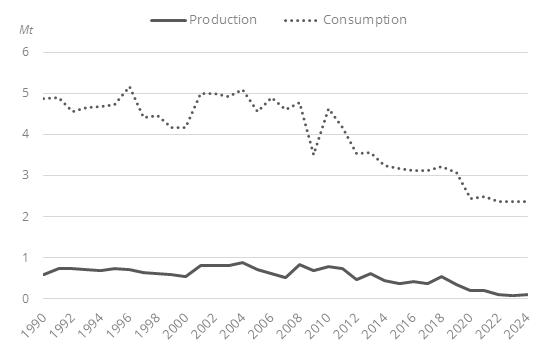
Coal consumption has been relatively stable since 2020, at around 2.4 Mt. It decreased by 4.4%/year between 2010 and 2019 and dropped by 21% in 2020. Coal production is very low and has decreased by almost 90% since 2010, reaching 0.1 Mt in 2024.
Industry (mainly steel) accounted for 28% of the consumption in 2024.
Source: Sweden energy report
Interactive Chart Sweden Coal and Lignite Production & Consumption
Source: Global Energy & CO2 data
Benefit from up to 2 000 up-to-date data series for 186 countries in Global Energy & CO2 data
View the detailed consumption trends at country level (graphs, tables, analysis) in the Sweden energy report
Sweden Renewable in % Electricity Production
STEM, the Swedish Energy Agency (Statens Energimyndighet), is in charge of implementing the renewable energy policy and is the accounting authority for certificates and guarantees of origin since 2015.
Source: Sweden energy report
Interactive Chart Sweden Share of Renewables in Electricity Production (incl hydro)
Source: Global Energy & CO2 data
Benefit from up to 2 000 up-to-date data series for 186 countries in Global Energy & CO2 data
Learn more about renewables in the European Battery Market Analysis
Sweden GHG emissions and CO2 emissions
In 2016, the government signed an Energy Agreement with the main political parties targeting net zero emissions by 2045 and negative emissions thereafter. This means that GHG emissions must be at least 85% lower in 2045 than in 1990. Emissions from domestic transport will be reduced by at least 70% by 2030 compared with 2010. In addition, GHG emissions from sectors outside the EU ETS should be reduced by 63% in 2030 and 75% in 2040 compared with 1990 levels. Carbon capture and storage may also be counted as a measure where there are no reasonable alternatives.
Source: Sweden energy report
Interactive Chart Sweden CO2 emissions
Source: Global Energy & CO2 data
Benefit from up to 2 000 up-to-date data series for 186 countries in Global Energy & CO2 data
View the detailed consumption trends at country level (graphs, tables, analysis) in the Sweden energy report