Slovenia Key Figures
- Population:
- 2.12 million
- GDP growth rate:
- 1.59 %/year
- Energy independence:
- 54.0%
Data of the last year available: 2023
- Total consumption/GDP:*
- 57.9 (2005=100)
- CO2 Emissions:
- 5.34 tCO2/capita
- Rate of T&D power losses:
- 6.36%
* at purchasing power parity
View all macro and energy indicators in the Slovenia energy report
Slovenia Energy News
View all news, archive your new and create your own daily newsletters only on your topics/countries of interest with Key Energy Intelligence
Slovenia Energy Research
Benefit from up to 2 000 up-to-date data series for 186 countries in Global Energy & CO2 data
A data overview is available in the global energy statistics app
Slovenia Total Energy Production & Consumption
Per capita consumption is 2.9 toe (4% higher than the EU average in 2023). Electricity consumption per capita exceeds 5 800 kWh (8% above the EU average).
Graph: CONSUMPTION TRENDS BY ENERGY SOURCE (Mtoe)
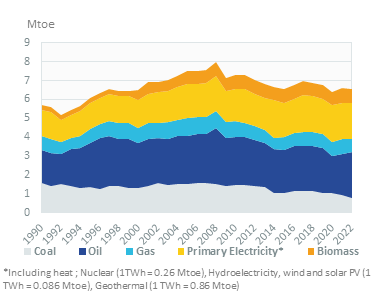
The country's total consumption declined by 3.5%/year since 2021 to 6.1 Mtoe in 2023 (2.7%/year at normal climate). Previously, it increased by 3%/year from 2015 to 2017 (+), before declining until 2020 (-2.7%/year) and rebounding by 2.7% in 2021.
Source: Slovenia energy report
Interactive Chart Slovenia Total Energy Production & Consumption
Source: Global Energy & CO2 data
Benefit from up to 2 000 up-to-date data series for 186 countries in Global Energy & CO2 data
View the detailed fondamentals of the market at country level (graphs, tables, analysis) in the Slovenia energy report
Slovenia Oil Production & Consumption
As the country's only refinery ceased operating in 1998, Slovenia imports all its oil products (4.5 Mt in 2023). Most of oil product imports came from Saudi Arabia (33% in 2023), Italy (19%), and Greece (9%).
Source: Slovenia energy report
Interactive Chart Slovenia Crude Oil Production & Consumption
Source: Global Energy & CO2 data
Interactive Chart Slovenia Refined Oil Products Production & Consumption
Source: Global Energy & CO2 data
Benefit from up to 2 000 up-to-date data series for 186 countries in Global Energy & CO2 data
Additionally, for more detailed information on refineries, you can request a sample of our EMEA Refineries Dataset
Slovenia Natural Gas Production & Consumption
After a 5% hike in 2021, natural gas consumption fell by 11% in 2022 and by 3.5% in 2023 to 0.8 bcm, back to its 2015 level. Previously, it had declined by 4.3%/year over 2005-2014 and recovered until 2021 (+3%/year), due to higher demand from industry and the power sector.
Slovenia followed the EU target to cut gas consumption between August 2022 and March 2023 by 15% (compared to the average consumption for the past 5 years) and achieved a 13.7% cut (-14% for large industrial users, and -22% for households).
Graph: NATURAL GAS CONSUMPTION (bcm)
Source: Slovenia energy report
Interactive Chart Slovenia Gas Production & Consumption
Source: Global Energy & CO2 data
Benefit from up to 2 000 up-to-date data series for 186 countries in Global Energy & CO2 data
Additionally, for more detailed information on the LNG trade, you can request a sample of our EMEA LNG Trade Dataset
Slovenia Coal and Lignite Production & Consumption
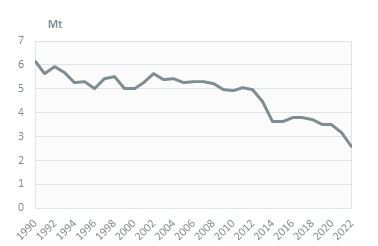
Lignite consumption decreased slightly in 2023 (-4%) to 2.4 Mt (half its 2010 level), after a 9% drop in 2021 and a 22% fall in 2022. Previously, it had eroded between 2002 and 2012 (by 1.2%/year), before collapsing in 2013 and 2014 (-15%/year) due to much lower demand from the power sector, the main consumer of lignite (98% in 2023).
Graph: COAL AND LIGNITE CONSUMPTION (Mt)
Graph: COAL AND LIGNITE CONSUMPTION BREAKDOWN BY SECTOR (2023, %)
Source: Slovenia energy report
Interactive Chart Slovenia Coal and Lignite Production & Consumption
Source: Global Energy & CO2 data
Benefit from up to 2 000 up-to-date data series for 186 countries in Global Energy & CO2 data
View the detailed consumption trends at country level (graphs, tables, analysis) in the Slovenia energy report
Slovenia Power Production & Consumption
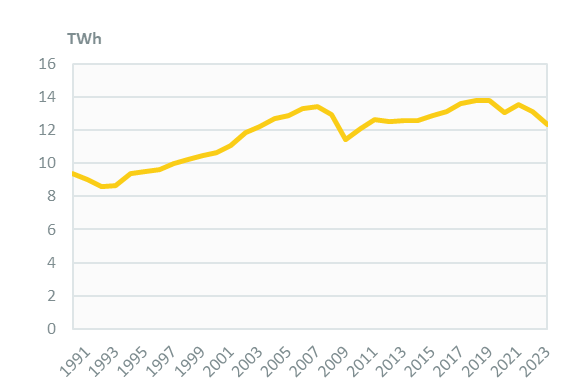
Electricity consumption has declined by almost 5%/year since 2021, reaching 12.3 TWh in 2023. It had grown by 1.9%/year over 2009-2019, before decreasing by 5.3% in 2020 and rebounding in 2021 (+3.9%).
Slovenia has followed the EU target to cut its monthly electricity consumption by 10% from November 2022 to March 2023, achieving an 8.2% reduction (-14% for business consumers but +1% for households and small businesses).
Graph: ELECTRICITY CONSUMPTION (TWh)
Source: Slovenia energy report
Interactive Chart Slovenia Power Production & Consumption
Source: Global Energy & CO2 data
Benefit from up to 2 000 up-to-date data series for 186 countries in Global Energy & CO2 data
View the detailed consumption trends at country level (graphs, tables, analysis) in the Slovenia energy report
Slovenia Renewable in % Electricity Production
Slovenia fell 1 point short of its objective of 25% of renewables in final consumption in 2020, achieving only 24.1%. The difference was compensated through the European Union's statistical transfer mechanism, the winning bid being from Czechia for €2m. In 2023, renewables covered 25% of final consumption, including 42% for electricity, 34% for heating and cooling, and 10% in transport.
Source: Slovenia energy report
Interactive Chart Slovenia Share of Renewables in Electricity Production (incl hydro)
Source: Global Energy & CO2 data
Benefit from up to 2 000 up-to-date data series for 186 countries in Global Energy & CO2 data
Learn more about renewables in the European Battery Market Analysis
Slovenia GHG emissions and CO2 emissions
The revised NECP (2024) increased the cut in GHG emissions in 2030 to at least 35-45% (compared to 2005) and at least 55% by 2033. It aims to cut GHG emissions by 62% in the ETS sector and by at least 28% in non-ETS sectors by 2030 compared to 2005 (-70% in buildings, -1% in transport, -2.8% in agriculture, -65% in waste management, and -40% in industry), and to achieve a sink of at least 146 ktCO2eq in the LULUCF sector.
In 2022, Slovenia's GHG emissions dipped by 1.9% to 15 MteqCO2, i.e. 7% above their 1990 level and 15% above their 2015 level.
Source: Slovenia energy report
Interactive Chart Slovenia CO2 emissions
Source: Global Energy & CO2 data
Benefit from up to 2 000 up-to-date data series for 186 countries in Global Energy & CO2 data
View the detailed consumption trends at country level (graphs, tables, analysis) in the Slovenia energy report