
- Update
-
- Format
- 4 files (PDF report, 3 Excel files)
- Pages
-
39 (Report only)
- Delivery
- Immediate by e-mail
- GENERAL OVERVIEW
- INSTITUTIONS AND ENERGY POLICY
- ENERGY COMPANIES
- ENERGY SUPPLY
- ENERGY PRICES
- ENERGY CONSUMPTION
- ISSUES AND PROSPECTS
- DATA TABLES
- ABBREVIATIONS
- GLOSSARY
Buy Slovenia energy report
Price without VAT. Depending on your statute and location, VAT might be applicable. Get in touch with us for more information.
After validation, you will immediately receive 4 files by email (one pdf report and 3 excel files containing the datasets).
Overview
This analysis includes a comprehensive Slovenia energy market report and updated datasets. It is derived from the most recent key economic indicators, supply and demand factors, oil and gas pricing trends and major energy issues and developments surrounding the energy industry. The report provides a complete picture of the country situation, dynamics, current issues and future prospects. With market data and continuous follow-up of markets news, this report brings clear and concise insights with which to tackle national energy challenges and opportunities. Browse the tabs below for a detailed table of contents, the list of graphs and tables, and details on the data files.
Highlights
- Slovenia introduced more ambitious targets on renewables, energy efficiency, and GHG emissions reduction for 2030 in its revised NECP.
- The country aims to phase out lignite by 2033 at the latest.
- HSE, a state-owned company, represents half of the power generation.
- Geoplin dominates the gas market (85% of the wholesale market and 46% of the retail market).
- National company Petrol is the largest fuel retailer.
- The share of CO2-free sources in the power mix has increased by 14 points since 2010 to 78% in 2023.
- Electricity and gas prices increased significantly in 2022 and 2023, despite support measures.
- Total energy consumption has declined rapidly since 2021.
- Slovenia is developing many electricity and gas interconnection projects.
- A second nuclear reactor of up to 2.4 GW is planned at Krško, and SMRs are under consideration.
Institutions & Energy Policy
The Energy Directorate of the Ministry of the Environment, Climate, and Energy is in charge of defining the energy policy objectives and regulating public utilities.
The Ministry of Infrastructure oversees transport and energy infrastructure and ensures energy supply is reliable.
The Energy Agency (Agencija za energijo) is in charge of regulating the energy markets.
Energy Companies
Electricity:
HSE, HoldingSlovenske Elektrarne (100% state-owned), is the largest electricity producer. Through its stakes in various companies, HSE operates 1.9 GW (43% of the total capacity at end-2023), consisting of 990 MW of thermal (including the 545 MW Šoštanj-6 unit commissioned in 2016) and 938 MW of hydro. In 2023, HSE generated 6.4 TWh, i.e.
Energy Supply
Resources:
Slovenia's energy resources are limited to subbituminous coal and lignite (315 Mt of lignite and 56 Mt of coal) and hydroelectricity (12.5 TWh).
Energy Prices
Electricity:
Electricity prices increased significantly in 2023 (+25% on average) despite support measures in the context of the European energy crisis, including a VAT cut and excise duty reductions for all electricity consumers, exemptions of network charge and renewable tax and price caps for households and small businesses).
Energy Consumption
Per capita consumption is 2.9 toe (4% higher than the EU average in 2023). Electricity consumption per capita exceeds 5 800 kWh (8% above the EU average).
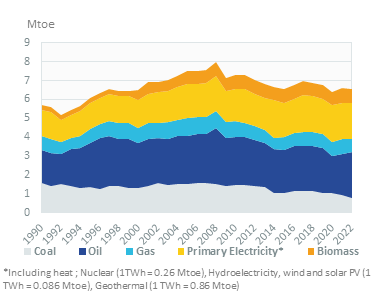
Graph: CONSUMPTION TRENDS BY ENERGY SOURCE (Mtoe)
Issues & Prospects
Gas:
According to Plinovodi's latest forecasts, gas consumption should remain stable at 10 TWh over 2024-2033, including 4.5 TWh for industry, 1.6 TWh for the power sector, and 3.3 TWh for buildings.
- GRAPH 1: CO2-energy emissions (MtCO2)
- GRAPH 2: Installed electric capacity by source (2023, %)
- GRAPH 3: Gross power production by source (TWh)
- GRAPH 4: Power generation by source (2023, %)
- GRAPH 5: Gasoline & diesel prices (€/l)
- GRAPH 6: Electricity prices for industry and households (€c/kWh)
- GRAPH 7: Gas prices for industry and households (€c/kWh GCV)
- GRAPH 8: Consumption trends by energy source (Mtoe)
- GRAPH 9: Total consumption market share by energy (2023 %)
- GRAPH 10: Final consumption market share by sector (2023, %)
- GRAPH 11: Oil consumption (Mt)
- GRAPH 12: Oil consumption breakdown by sector (2023, %)
- GRAPH 13: Electricity consumption (TWh)
- GRAPH 14: Electricity consumption breakdown by sector (2023, %)
- GRAPH 15: Natural gas consumption (bcm)
- GRAPH 16: Gas consumption breakdown by sector (2023, %)
- GRAPH 17: Coal and lignite consumption (Mt)
- GRAPH 18: Coal and lignite consumption breakdown by sector (2023, %)
- Economic Indicators: Annual historical data including population, GDP growth, imports and exports, inflation rate, energy security and efficiency indicators, CO2 emissions.
- Supply Indicators: Historical data including oil and gas reserves, electric and refining capacity, energy production, power production and external trade. All are detailed by energy source.
- Demand Indicators: Historical data including consumption per inhabitant, consumption trends, total consumption by energy source, final consumption by energy source and sector, and electricity consumption by sector.
- Energy Balances: Single table displaying the overall energy industry balance per annum, also graphically displayed by energy sub-segment.
- Infrastructure Projects: Covers power plant projects by energy, technology, status and operator.
The Slovenia energy market data since 1990 and up to
is included in the Excel file accompanying the Slovenia country report.
It showcases the historical evolution, allowing users to easily work with the data.
Key Data included in the excelsheet:
- Economic indicators: Annual historical economic indicators, energy security, energy efficiency and CO2 emissions.
- Supply indicators: Annual historical reserves, capacity, production and external trade (imports(+) exports(-) balance).
- Demand indicators: Annual historical consumption per capita, consumption trends, total consumption, final consumption (per energy and per sector) and electricity consumption total and per sector.
- Energy Balance: total and per energy.
- Slovenia Energy Prices: In addition to the analysis provided on the report we also provided a data set which includes historical details on the Slovenia energy prices for the follow items: price of premium gasoline (taxes incl.), price of diesel (taxes incl.), price of electricity in industry (taxes incl.), price of electricity for households (taxes incl.), price of natural gas in industry (taxes incl.), prices of natural gas for households (taxes incl.), spot price of Brent and CO2 emissions (from fuel combustion).
The Slovenia country dashboards are complemented with country forecasts from EnerFuture (excel file) with scenario comparison.
Data included in the excelsheet:
- Demand: Primary energy consumption, final energy consumption, by fuel, by sector.
- Power: Electricity generation & capacities, by technology.
- CO2: Total CO2 emissions.
- Macro-economy: Main macro-economic assumptions.
- Key indicators: Energy intensity, share of renewables, CO2 emissions per capita and per unit of GDP.