Qatar Key Figures
- Population:
- 2.68 million
- GDP growth rate:
- 2.37 %/year
- Energy independence:
- 100%
Data of the last year available: 2024
- Total consumption/GDP:*
- 86.5 (2005=100)
- CO2 Emissions:
- 36.3 tCO2/capita
- Rate of T&D power losses:
- 5.70%
* at purchasing power parity
View all macro and energy indicators in the Qatar energy report
Qatar Energy News
View all news, archive your new and create your own daily newsletters only on your topics/countries of interest with Key Energy Intelligence
Qatar Energy Research
Benefit from up to 2 000 up-to-date data series for 186 countries in Global Energy & CO2 data
A data overview is available in the global energy statistics app
Qatar Total Energy Production & Consumption
The country's total energy consumption per capita is very high at over 20 toe (2nd highest in the world), including 20.7 MWh of electricity (2nd highest).
Total energy consumption has been growing by 2%/year on average since 2012, reaching 54 Mtoe in 2024. It grew very rapidly between 2000 and 2013 (around 10%/year).
Total consumption is dominated by gas (73%), followed by oil (27%). The share of gas has reduced by 7 points since 2021.
Graph: CONSUMPTION TRENDS BY ENERGY SOURCE (Mtoe)
Source: Qatar energy report
Interactive Chart Qatar Total Energy Production & Consumption
Source: Global Energy & CO2 data
Benefit from up to 2 000 up-to-date data series for 186 countries in Global Energy & CO2 data
View the detailed fondamentals of the market at country level (graphs, tables, analysis) in the Qatar energy report
Qatar Oil Production & Consumption
Oil production has been rising since 2021, reaching 76 Mt in 2023 (1.8%/year on average). It reached a peak in 2014 (82 Mt) and fell until 2021 at an average rate of 2%/year. It progressed rapidly between 2005 and 2014 (6.3%/year), with the increase in NGL production (around 50% of the production).
Qatar exports around 50% of its oil production (crude and NGL), as well as 70% of its oil products (29 Mt produced, 20 Mt exported in 2024).
Source: Qatar energy report
Interactive Chart Qatar Crude Oil Production & Consumption
Source: Global Energy & CO2 data
Interactive Chart Qatar Refined Oil Products Production & Consumption
Source: Global Energy & CO2 data
Benefit from up to 2 000 up-to-date data series for 186 countries in Global Energy & CO2 data
Additionally, for more detailed information on refineries, you can request a sample of our EMEA Refineries Dataset
Qatar Natural Gas Production & Consumption
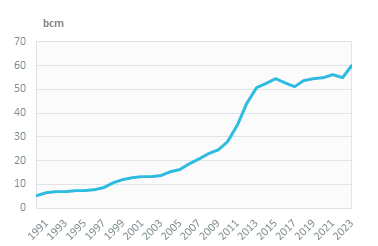
Natural gas consumption has been rather stable since 2022, (57 bcm in 2024), after a slow progression over 2018-2021 (1.4%/year). It increased extremely rapidly between 2005 and 2015 (13%/year) and then remained stable until 2018.
The oil and gas sector consumes 52% of the total, electricity production 27%, and industry 21% (including non-energy uses).
Graph: NATURAL GAS CONSUMPTION (bcm)
Graph: GAS CONSUMPTION BREAKDOWN BY SECTOR (2024, %)
Source: Qatar energy report
Interactive Chart Qatar Gas Production & Consumption
Source: Global Energy & CO2 data
Benefit from up to 2 000 up-to-date data series for 186 countries in Global Energy & CO2 data
Additionally, for more detailed information on the LNG trade, you can request a sample of our EMEA LNG Trade Dataset
Qatar Power Production & Consumption
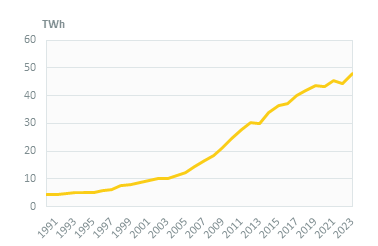
Electricity consumption progressed by 6.5%/year since 2020 to 56 TWh in 2024. It ramped up very rapidly between 2000 and 2019 (9%/year on average) with the increasing use of air conditioning and the soaring water desalinisation industry. It has increased by 4%/year on average since then.
The residential sector accounts for 47% of that consumption, followed by industry with 24% and services with 29%.
Graph: ELECTRICITY CONSUMPTION (TWh)
Source: Qatar energy report
Interactive Chart Qatar Power Production & Consumption
Source: Global Energy & CO2 data
Benefit from up to 2 000 up-to-date data series for 186 countries in Global Energy & CO2 data
View the detailed consumption trends at country level (graphs, tables, analysis) in the Qatar energy report
Qatar Renewable in % Electricity Production
The Third National Development Strategy 2024-2030 aims to reach 18% of renewables in the power mix by 2030 and targets 4 GW of new large-scale renewable energy capacity, with a focus on solar PV.
The target of a solar capacity of 1 800 MW in 2020 was not reached, as the first 800 MW solar plant was only connected to the grid in 2022.
Kahramaa has launched a distributed solar energy service, BeSolar, and implemented a net billing mechanism for surplus solar electricity injected into the grid (QAR 0.237/kWh, or US$65c/kWh).
Source: Qatar energy report
Interactive Chart Qatar Share of Renewables in Electricity Production (incl hydro)
Source: Global Energy & CO2 data
Benefit from up to 2 000 up-to-date data series for 186 countries in Global Energy & CO2 data
Qatar GHG emissions and CO2 emissions
In its updated NDC (2021), Qatar pledged to reduce its GHG emissions in 2030 by 25% relative to a BaU scenario.
The Qatar National Renewable Energy Strategy (2024) also aims at reducing the CO2 intensity of power generation by 27% compared to 2021 by 2030.
According to Edgar data base, GHG emissions have increased by 4%/year since 2000, reaching 150 MtCO2eq in 2023. A large part of these emissions came from oil and gas exploitation.
Source: Qatar energy report
Interactive Chart Qatar CO2 emissions
Source: Global Energy & CO2 data
Benefit from up to 2 000 up-to-date data series for 186 countries in Global Energy & CO2 data
View the detailed consumption trends at country level (graphs, tables, analysis) in the Qatar energy report