Papua New Guinea Key Figures
- Population:
- 10.4 million
- GDP growth rate:
- 3.81 %/year
- Energy independence:
- 100%
Data of the last year available: 2023
- Total consumption/GDP:*
- 99.9 (2015=100)
- CO2 Emissions:
- 0.78 tCO2/cap
- Rate of T&D power losses:
- 7.82%
* at purchasing power parity
View all macro and energy indicators in the Papua New Guinea energy report
Papua New Guinea Energy News
View all news, archive your new and create your own daily newsletters only on your topics/countries of interest with Key Energy Intelligence
Papua New Guinea Energy Research
- Papua New Guinea's Energy & Climate Policy Framework: PNG aims for 57% renewables in power mix by 2027 and carbon neutrality in energy sector by 2030. The government is implementing strategic plans to boost renewables, energy efficiency, and regulate oil, gas, and electricity sectors.
- Papua New Guinea's Energy Companies: "PPL, PNG's state-owned power utility, holds 50% of electricity generation capacity, while Oil Search and ExxonMobil lead the oil and gas sector. PPL faces insolvency and tariff challenges, with independent producers and auto-producers supplementing capacity. The energy sector includes upstream, midstream, and downstream operations, with KPHL representing state interests in oil and gas projects."
- Papua New Guinea's Energy Supply & Demand: PNG's power grid is fragmented, with frequent outages. Oil dominates energy use (45%), followed by gas (17%) and biomass (35%). Electricity generation is 4.6 TWh, with oil (51%) and gas (25%) leading. The grid suffers from high transmission losses. Gas production is 14 bcm, mostly exported as LNG. GHG emissions rose to 12 MtCO2eq in 2023.
- Papua New Guinea's Energy Use & Price by Sector: In 2023, PNG's final energy demand reached 3.3 Mtoe, with biomass and petroleum products dominating supply. Residential, commercial, and agricultural sectors accounted for 55% of consumption, while electrification remained low at 19%. Industry and transport saw increased reliance on oil products. Energy prices have fluctuated, with transport fuel costs decreasing post-2023.
- Papua New Guinea's Issues & Prospects: PNG plans to expand its energy sector, with projects including the P’nyang gas field and a second LNG plant. Electricity targets aim for 2 GW by 2030, with 70% grid access, and 4.6 GW by 2050, dominated by renewables. Key projects include gas, hydro, and geothermal initiatives, supported by international funding.
Benefit from up to 2 000 up-to-date data series for 186 countries in Global Energy & CO2 data
A data overview is available in the global energy statistics app
Papua New Guinea Total Energy Production & Consumption
Primary energy consumption has increased by 3%/year since 2017.
Oil is the dominant fuel in the energy mix (45% in 2023). The share of natural gas has increased by 13 points since 2010 to 17% in 2023, while the share of primary electricity (hydro and geothermal) and biomass decreased significantly (by 8 pp each) to 3.5% and 35%, respectively.
Per capita primary energy consumption reached 0.46 toe/cap in 2023.
Graph: Primary Consumption Trends by Energy Source
Source: Papua New Guinea energy report
Interactive Chart Papua New Guinea Total Energy Production & Consumption
Source: Global Energy & CO2 data
Benefit from up to 2 000 up-to-date data series for 186 countries in Global Energy & CO2 data
View the detailed fondamentals of the market at country level (graphs, tables, analysis) in the Papua New Guinea energy report
Papua New Guinea Oil Production & Consumption
Crude oil production has increased by 2%/year since 2021 to 1.3 Mt/year in 2023. It rose rapidly from 2010 to 2020 (15%/year), reaching 1.4 Mt. Before 2010, it declined steadily from around 3.6 Mt in 2000 to 2 Mt in 2009.
The country has one refinery with a capacity of 32.5 kbl/d.
Graph: Crude Oil Production & Consumption
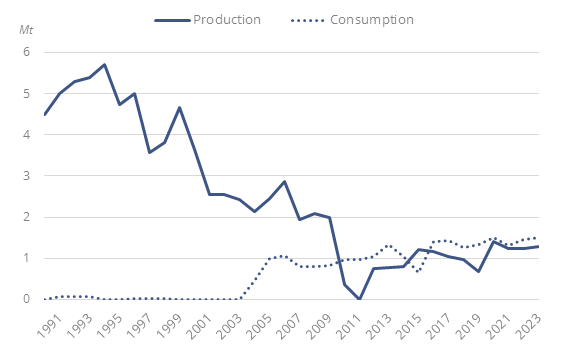
PNG remains a net importer of petroleum products, as its production covers 85% of its consumption.
Source: Papua New Guinea energy report
Interactive Chart Papua New Guinea Crude Oil Production & Consumption
Source: Global Energy & CO2 data
Interactive Chart Papua New Guinea Refined Oil Products Production & Consumption
Source: Global Energy & CO2 data
Benefit from up to 2 000 up-to-date data series for 186 countries in Global Energy & CO2 data
Additionally, for more detailed information on refineries, you can request a sample of our Asia Refineries Dataset
Papua New Guinea Natural Gas Production & Consumption
Gas production has increased by 2%/year since 2015, reaching 14 bcm in 2023. It rose very rapidly in 2014 and 2015 with the commissioning of an export LNG plant, to 6 bcm and 11.8 bcm, respectively. In 2018, the LNG plant was stopped for almost two months following a severe earthquake.
Source: Papua New Guinea energy report
Interactive Chart Papua New Guinea Gas Production & Consumption
Source: Global Energy & CO2 data
Benefit from up to 2 000 up-to-date data series for 186 countries in Global Energy & CO2 data
Additionally, for more detailed information on the LNG trade, you can request a sample of our Asia LNG Trade Dataset
Papua New Guinea Renewable in % Electricity Production
In 2020, the Government updated its National Determined Contribution (NDC) and committed to raise the share of renewables in the grid-connected installed capacity from 30% in 2015 to 78% in 2030. The target was lowered compared to the previous NDC submitted in 2016 (100% renewables by 2030), due to an increase of use of gas in the power sector. This target was confirmed in 2023 in the fourth MTDP and advanced to 2027. In 2023, this share reached 30% (24% in the power generation mix).
Source: Papua New Guinea energy report
Interactive Chart Papua New Guinea Share of Renewables in Electricity Production (incl hydro)
Source: Global Energy & CO2 data
Benefit from up to 2 000 up-to-date data series for 186 countries in Global Energy & CO2 data
Learn more about renewables in the Mini grid Africa & Asia markets for village electrification
Papua New Guinea GHG emissions and CO2 emissions
The Papua New Guinea Climate Change (Management) Act 2015 established the Climate Change Development Authority (CCDA) and the Climate Change and Green Growth Trust Fund. CCDA launched the development of the Pathway to NDC 3.0 in 2025.
Source: Papua New Guinea energy report
Interactive Chart Papua New Guinea CO2 emissions
Source: Global Energy & CO2 data
Benefit from up to 2 000 up-to-date data series for 186 countries in Global Energy & CO2 data
View the detailed consumption trends at country level (graphs, tables, analysis) in the Papua New Guinea energy report