Panama Key Figures
- Population:
- 4.52 million
- GDP growth rate:
- 2.86 %/year
- Energy independence:
- 25.2%
Data of the last year available: 2024
- Total consumption/GDP:*
- 80.3 (2015=100)
- CO2 Emissions:
- 1.96 tCO2/cap
- Rate of T&D power losses:
- 5.76%
* at purchasing power parity
View all macro and energy indicators in the Panama energy report
Panama Energy News
View all news, archive your new and create your own daily newsletters only on your topics/countries of interest with Key Energy Intelligence
Panama Energy Research
- Panama's Energy & Climate Policy Framework: Panama aims for 1.7GW distributed renewables by 2030, 30% solar/wind capacity by 2050, and 11% GHG reduction by 2035.
- Panama's Energy Companies: Three major firms dominate Panama’s electricity sector: AES, Gatun, and Enel generate ~60% of power, while Naturgy controls two of three distribution companies.
- Panama's Energy Supply & Demand: Panama’s energy mix shifted to 73% renewables in 2024, reducing oil reliance. All oil products are imported. Electricity capacity reached 5.1 GW, with gas and renewables expanding.
- Panama's Energy Use & Price by Sector: Oil dominates final energy use (64%), with buildings and transport each consuming 41%. Electricity prices stable in industry; fuel prices fell in transport.
- Panama's Issues & Prospects: Panama aims to diversify energy mix with wind, solar, and gas projects by 2039, despite delays in key infrastructure.
Benefit from up to 2 000 up-to-date data series for 186 countries in Global Energy & CO2 data
A data overview is available in the global energy statistics app
Panama Total Energy Production & Consumption
Total energy consumption dipped by 7% in 2024 to 4.6 Mtoe after rapid growth since 2021 (6%/year peak). It grew by around 4%/year from 2010 to 2019; after a 37% drop in 2020, it rebounded by 41% in 2021, driven by very high economic growth. Consumption per capita is low, at 1 toe in 2024, slightly under the Latin America average (1.4 toe). Oil covered 68% of primary energy consumption in 2024 (-13 pp since 2010), followed by hydropower (14%, +4 pp), gas (8%, +8 pp), biomass (7%, -2 pp), and wind and solar (3%).
Graph: Primary Consumption Trends by Energy Source
Source: Panama energy report
Interactive Chart Panama Total Energy Production & Consumption
Source: Global Energy & CO2 data
Benefit from up to 2 000 up-to-date data series for 186 countries in Global Energy & CO2 data
View the detailed fondamentals of the market at country level (graphs, tables, analysis) in the Panama energy report
Panama Oil Production & Consumption
Panama imports all its oil products (3.6 Mt in 2024), as the production of oil products ceased in 2003 when the refinery was transformed into an import terminal.
Under the terms of the treaty signed in 1977, the Panama Canal came under Panamanian sovereignty in 1999. In 1982, in order to cope with the increase in traffic, the country commissioned the 200 kb/d Trans Panama pipeline (PetroTerminal of Panama S.A.), which runs 131 km through the Panamanian Isthmus.
Source: Panama energy report
Interactive Chart Panama Crude Oil Production & Consumption
Source: Global Energy & CO2 data
Interactive Chart Panama Refined Oil Products Production & Consumption
Source: Global Energy & CO2 data
Benefit from up to 2 000 up-to-date data series for 186 countries in Global Energy & CO2 data
Additionally, for more detailed information on refineries, you can request a sample of our America Refineries Dataset
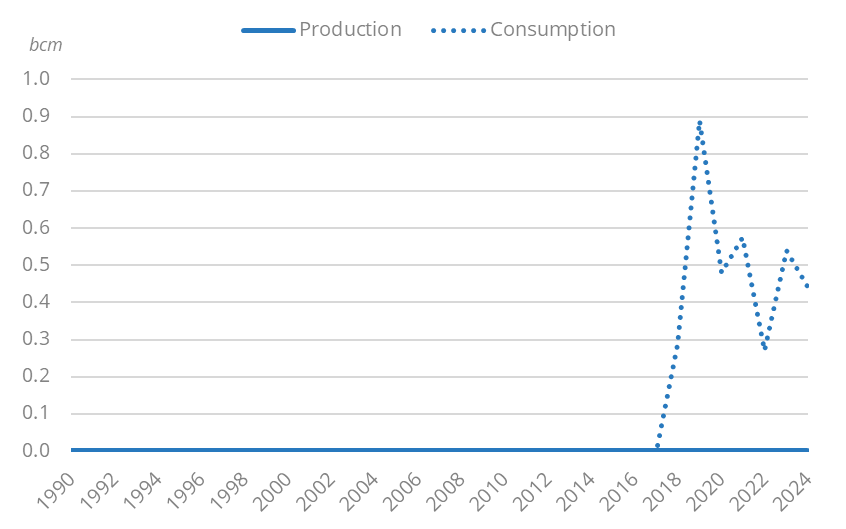
Panama Natural Gas Production & Consumption
Panama started to import natural gas as LNG in 2018, following the commissioning of the Costa Norte LNG import terminal, with a capacity of 2 bcm/year. In 2024, the country imported 0.6 bcm from the United States. AES's subsidiary Gas Natural Atlántico will import up to 0.4 Mt/year of LNG from Engie over 2018-2027.
All the gas is consumed in the power sector.
Graph: Gas Production & Consumption
Source: Panama energy report
Interactive Chart Panama Gas Production & Consumption
Source: Global Energy & CO2 data
Benefit from up to 2 000 up-to-date data series for 186 countries in Global Energy & CO2 data
Additionally, for more detailed information on the LNG trade, you can request a sample of our America LNG Trade Dataset
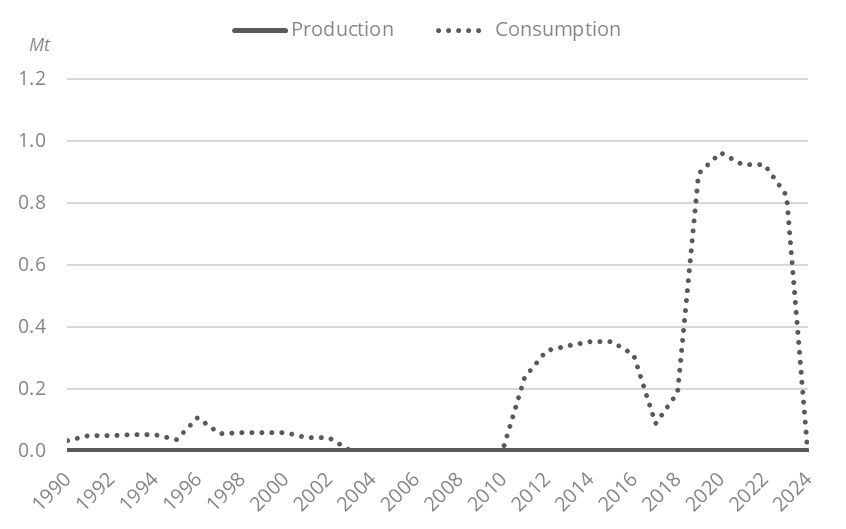
Panama Coal and Lignite Production & Consumption
Panama does not produce coal and used to import coal (ranging from 87 kt to 965 kt between 2011 and 2023) for a coal-fired power plant located at a copper mine. Since the power plant was mothballed in 2024, coal imports and consumption have fallen to zero.
Graph: Coal Production & Consumption
Source: Panama energy report
Interactive Chart Panama Coal and Lignite Production & Consumption
Source: Global Energy & CO2 data
Benefit from up to 2 000 up-to-date data series for 186 countries in Global Energy & CO2 data
View the detailed consumption trends at country level (graphs, tables, analysis) in the Panama energy report
Panama Renewable in % Electricity Production
The second NDC (2024) targets 1.7 GW of distributed renewables by 2030 (solar and wind, large hydro excluded), which should cover 20% of energy consumption. The NDC 3.0 (November 2025) does not include any renewable target but estimates thatnon-conventional renewables should account for 30% of the installed capacity in 2050.
Source: Panama energy report
Interactive Chart Panama Share of Renewables in Electricity Production (incl hydro)
Source: Global Energy & CO2 data
Benefit from up to 2 000 up-to-date data series for 186 countries in Global Energy & CO2 data
Panama GHG emissions and CO2 emissions
The second NDC (2024) did not include a quantitative objective of reductions in total GHG emissions. It aims to cut total emissions from the energy sector by at least 11.5% by 2030 and by at least 24% by 2050 compared to a BaU scenario, representing up to 10 MtCO2eq of avoided emissions over 2022-2030 and 60 MtCO2eq over 2022-2050.
Source: Panama energy report
Interactive Chart Panama CO2 emissions
Source: Global Energy & CO2 data
Benefit from up to 2 000 up-to-date data series for 186 countries in Global Energy & CO2 data
View the detailed consumption trends at country level (graphs, tables, analysis) in the Panama energy report