Netherlands Key Figures
- Population:
- 18.0 million
- GDP growth rate:
- 0.98 %/year
- Energy independence:
- 31.1%
Data of the last year available: 2024
- Total consumption/GDP:*
- 70.7 (2015=100)
- CO2 Emissions:
- 6.00 tCO2/cap
- Rate of T&D power losses:
- 4.34%
* at purchasing power parity
View all macro and energy indicators in the Netherlands energy report
Netherlands Energy News
View all news, archive your new and create your own daily newsletters only on your topics/countries of interest with Key Energy Intelligence
Netherlands Energy Research
- Netherlands's Energy & Climate Policy Framework: The Netherlands aims for 39% renewable energy and 55% GHG reduction by 2030, with policies overseen by key ministries and agencies. The energy market is liberalised, with targets for zero-emission vehicles and green electricity. Renewable support schemes and efficiency measures are in place, though current policies may fall short of 2030 goals.
- Netherlands's Energy Companies: Top Dutch energy firms RWE, Eneco, and Vattenfall generate 24% of electricity, while autoproducers supply 33%. Key players in oil and gas include Shell, ExxonMobil, and state-owned entities like EBN and GasTerra.
- Netherlands's Energy Supply & Demand: The Netherlands has significantly reduced gas production (89% since 2013) while solar capacity surged, now representing 39% of total capacity. Renewables account for 52% of the power mix in 2024. Energy consumption has stabilised at 61 Mtoe, with oil and gas shares decreasing. Emissions have fallen 32% since 1990, with CO₂ per capita at 6.0 t in 2024.
- Netherlands's Energy Use & Price by Sector: In 2024, household electricity prices in the Netherlands fell by 23% after a 2023 surge, while industrial prices dropped by 18% but remained 65% higher than in 2021. The country has the EU's second-highest fuel prices. Electricity's share of final energy consumption rose to 19% in 2024, projected to reach 53% by 2050. Industrial energy use declined by 0.7% annually since 2010, with gas dominant. Transport energy demand fell by 1% yearly, heavily reliant on oil. Residential, services, and agriculture saw a 1.5% annual decrease, with gas and electricity as primary sources. Government tax reliefs and price caps supported energy affordability.
- Netherlands's Issues & Prospects: The Netherlands aims to expand offshore wind capacity to 70 GW by 2050, with interim targets of 21 GW by 2032 and 30-40 GW by 2040. Gasunie plans a 10 GW hydrogen transport network by 2035. Electricity demand is projected to rise significantly, driven by wind and other renewable projects. Nuclear and biomass initiatives are also underway, alongside CCS and LNG infrastructure developments.
Benefit from up to 2 000 up-to-date data series for 186 countries in Global Energy & CO2 data
A data overview is available in the global energy statistics app
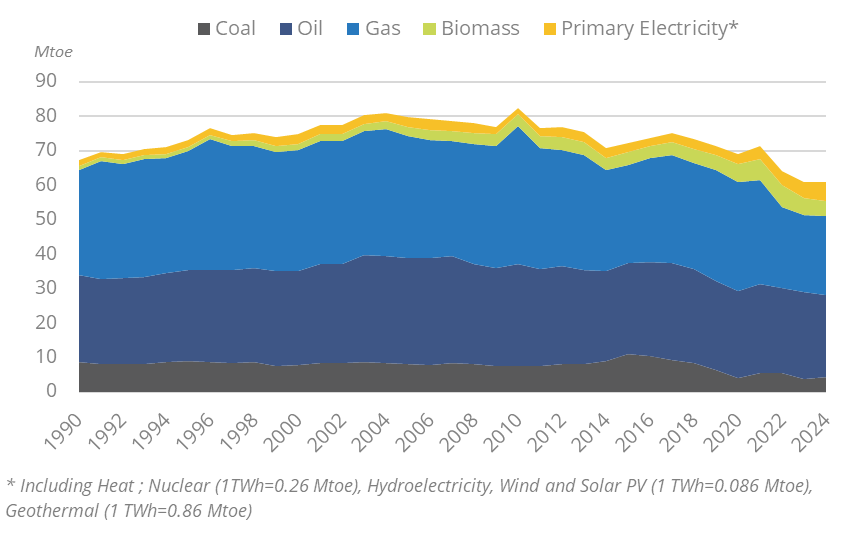
Netherlands Total Energy Production & Consumption
Total energy consumption decreased rapidly from 2021 to 2023 (-7%/year) and remained stable in 2024 (61 Mtoe). It was decreasing over 2016-2019 (-1%/year), after slight growth between 2014 and 2016 (+1.5%/year) thanks to the economic recovery, and a decrease of more than 1%/year between 2007 and 2014 due to the economic slowdown.
Graph: Primary Consumption Trends by Energy Source
Source: Netherlands energy report
Interactive Chart Netherlands Total Energy Production & Consumption
Source: Global Energy & CO2 data
Benefit from up to 2 000 up-to-date data series for 186 countries in Global Energy & CO2 data
View the detailed fondamentals of the market at country level (graphs, tables, analysis) in the Netherlands energy report
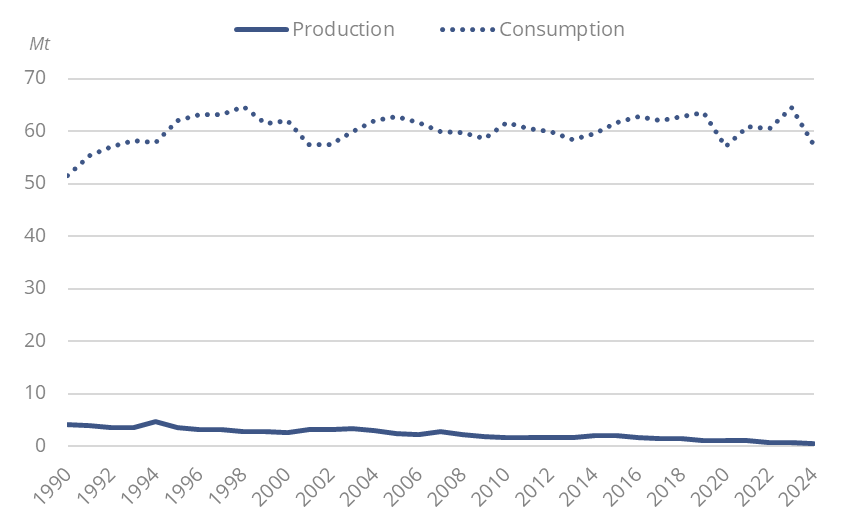
Netherlands Oil Production & Consumption
Crude oil production is low and decreasing (0.6 Mt in 2024). Crude imports (57 Mt in 2024) mainly came from the US. The share of Russia dropped from 31% in 2021 to 0.5% in 2022;in 2023, there were no imports from Russia.
Graph: Crude Oil Production & Consumption
Source: Netherlands energy report
Interactive Chart Netherlands Crude Oil Production & Consumption
Source: Global Energy & CO2 data
Interactive Chart Netherlands Refined Oil Products Production & Consumption
Source: Global Energy & CO2 data
Benefit from up to 2 000 up-to-date data series for 186 countries in Global Energy & CO2 data
Additionally, for more detailed information on refineries, you can request a sample of our EMEA Refineries Dataset
Netherlands Natural Gas Production & Consumption
Gas production has dropped by 89% since 2013, from 87 bcm to 10 bcm in 2024 (-18%in 2024), due to the production cap imposed on the Groningen field.
Source: Netherlands energy report
Interactive Chart Netherlands Gas Production & Consumption
Source: Global Energy & CO2 data
Benefit from up to 2 000 up-to-date data series for 186 countries in Global Energy & CO2 data
Additionally, for more detailed information on the LNG trade, you can request a sample of our EMEA LNG Trade Dataset
Netherlands Coal and Lignite Production & Consumption
The Netherlands imports all its coal consumption. Coal imports decreased by 3% in 2024 to 6.5 Mt, after a 28% decline in 2023 and a 3% increase in 2022. In 2021, imports increased by 41%. Between 2015 and 2019, coal imports decreased rapidly, by 14%/year, and then dropped by 42% in 2020 to 6 Mt.
Source: Netherlands energy report
Interactive Chart Netherlands Coal and Lignite Production & Consumption
Source: Global Energy & CO2 data
Benefit from up to 2 000 up-to-date data series for 186 countries in Global Energy & CO2 data
View the detailed consumption trends at country level (graphs, tables, analysis) in the Netherlands energy report
Netherlands Renewable in % Electricity Production
EZK is in charge of renewable energy policy, including the Stimulation of Sustainable Energy Production (SDE++ since 2020, Stimulering Duurzame Energieproductie) programme.
Source: Netherlands energy report
Interactive Chart Netherlands Share of Renewables in Electricity Production (incl hydro)
Source: Global Energy & CO2 data
Benefit from up to 2 000 up-to-date data series for 186 countries in Global Energy & CO2 data
Learn more about renewables in the European Battery Market Analysis
Netherlands GHG emissions and CO2 emissions
In its 2024 NECP, the Netherlands raised its reduction target in 2030 to at least 55% compared to 1990 levels (including LULUCF) (compared to 49% before). A total investment budget of €300m per year has been put in place over 2018-30 to promote actions to meet this target. According to the Climate and Energy Outlook 2025 of PBL, this target will not be met as GHG emissions are expected to decrease by between 45-53% in 2030, considering adopted and proposed policies.
Source: Netherlands energy report
Interactive Chart Netherlands CO2 emissions
Source: Global Energy & CO2 data
Benefit from up to 2 000 up-to-date data series for 186 countries in Global Energy & CO2 data
View the detailed consumption trends at country level (graphs, tables, analysis) in the Netherlands energy report