
- Format
- 4 files (PDF report, 3 Excel files)
- Pages
-
64 (Report only)
- Delivery
- Immediate by e-mail
- GENERAL OVERVIEW
- ENERGY AND CLIMATE POLICY FRAMEWORK
- ENERGY COMPANIES
- ENERGY SUPPLY AND DEMAND
- ENERGY USE AND PRICE BY SECTOR
- ISSUES AND PROSPECTS
- STATISTICS
- ABBREVIATIONS
- GLOSSARY
Buy Netherlands energy report
Price without VAT. Depending on your status and location, VAT might be applicable. Get in touch with us for more information.
After validation, you will immediately receive 4 files by email (one pdf report and 3 excel files containing the datasets).
Overview
The Netherlands pursues ambitious climate and energy goals, targeting a 55% reduction in greenhouse gas emissions by 2030 and a 39% renewable energy share. Key policies include phasing out coal, expanding offshore wind, and promoting green hydrogen, while regulatory bodies oversee market liberalisation and infrastructure development.
Get more details on the table of contents and data files, as well as the list of graphs and tables by browsing the tabs below.
Highlights
- The country targets a 39% share of renewables in the final energy consumption and at least a 55% reduction in GHG emissions in 2030.
- The three largest power generators, RWE, Eneco, and Vattenfall, only contribute around ¼ of total production, while autoproducers represent around 1/3 of the total.
- Gas production has dropped by 89% since 2013.
- Solar capacity has soared by more than 9 GW since 2021 and now represents 39% of the total.
- The share of renewables in the power mix has increased by 41 points since 2010, reaching 52% in 2024.
- Electricity prices for households decreased by 23% in 2024 after quadrupling in 2023. Electricity prices for industries decreased by 18% in 2024 but are still 65% higher than in 2021.
- The country has the second highest gasoline and diesel prices in the EU.
- The government set a target of 21 GW of offshore wind in 2032, 30-40 GW in 2040, and 70 GW in 2050.
- Gasunie aims to build a 10 GW national transport network for hydrogen for early 2035.
Energy & Climate Policy Framework
EZK, the Ministry of Climate Policy and Green Growth, through the Directorate-General for Climate and Energy, oversees the establishment of national energy and climate policies.)
Energy Companies
Electricity:
RWE has a capacity of 6 GW (including 3.7 GW of gas, 1.5 GW of coal, and 0.8 of renewables), which produced 15 TWh in 2024 (12% of total production).
Eneco (Mitsubishi 80%, Chubu 20% since 2020) has a capacity of 5.8 GW, including 3.1 GW of wind and 1.7 GW of solar, and produced 8.9 TWh in 2024 (7% of the total).
Energy Supply & Demand
Oil:
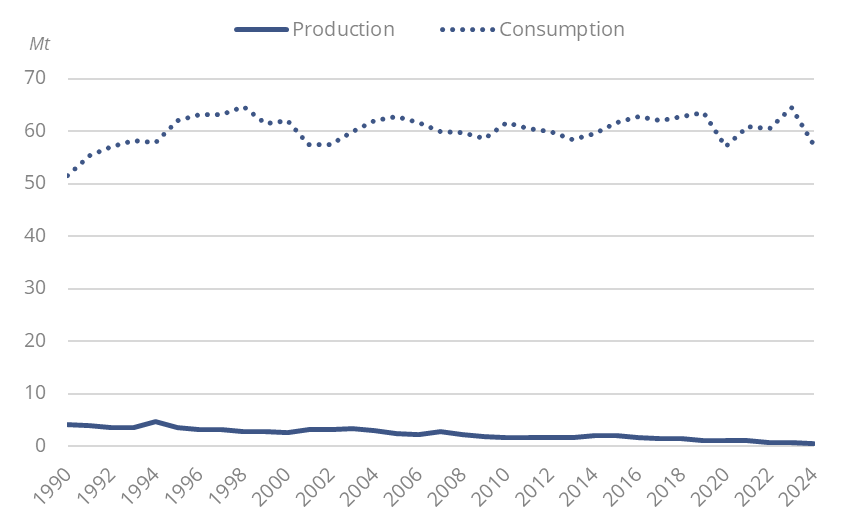
Crude oil production is low and decreasing (0.6 Mt in 2024). Crude imports (57 Mt in 2024) mainly came from the US. The share of Russia dropped from 31% in 2021 to 0.5% in 2022;in 2023, there were no imports from Russia.
Graph: Crude Oil Production & Consumption
Energy Use and Price by Sector
Energy Prices in Residential:
Electricity prices for households decreased by 23% in 2024 to €24c/kWh, after quadrupling in 2023 (€32c/kWh).
In 2024, gas prices decreased by 7% for households, reaching €16.6c/kWh. In 2023, a price cap of €1.45/cm (from €1.50/cm) was introduced on gas for households and othersmall-scale users for a maximum of 1 200 cm; the cap ended in 2024.
Issues & Prospects
According to the Energy and Climate Outlook 2025, primary energy consumption is forecast to decline to 2 170 PJ (53.7 Mtoe) in 2030 (range of 2 043 to 2 297 PJ, i.e. 48.8 to 54.9 Mtoe). The decline would mainly come from space heating and would mostly affect natural gas consumption.
- Graph 1: Final Intensity to GDP
- Graph 2: Primary Consumption Trends by Energy Source
- Graph 3: Total Consumption Market Share by Energy (2024)
- Graph 4: Installed Electric Capacity by Source
- Graph 5: Installed Electric Capacity by Source (2024)
- Graph 6: Gross Power Production by Source & Consumption
- Graph 7: Power Generation by Source (2024)
- Graph 8: CO2 Intensity of Electricity Generation
- Graph 9: Crude Oil Production & Consumption
- Graph 10: Petroleum Products Production & Consumption
- Graph 11: Gas Production & Consumption
- Graph 12: Coal Production & Consumption
- Graph 13: Emissions of GHG and CO2 from Fuel Combustion
- Graph 14: CO2-Emissions per Capita
- Graph 15: CO2 Intensity to GDP
- Graph 16: Final Demand Trends by Energy Source
- Graph 17: Final Consumption by Sector
- Graph 18: Final Consumption Market Share by Sector (2024)
- Graph 19: Share of Electricity in Total Final Energy Consumption
- Graph 20: Final Consumption in Industry by Energy Source
- Graph 21: Energy Prices in Industry (Taxes Included)
- Graph 22: Final Consumption in Transport by Energy Source
- Graph 23: Energy Prices in Transport (Taxes Included)
- Graph 24: Final Consumption in Residential, Services, Agriculture by Energy Source
- Graph 25: Energy Prices in Residential (Taxes Included)
- Graph 26: Upcoming New Capacity by Energy Source
- Economic Indicators: Annual historical data including population, GDP growth, imports and exports, inflation rate, energy security and efficiency indicators, CO2 emissions.
- Supply Indicators: Historical data including oil and gas reserves, electric and refining capacity, energy production, power production and external trade. All are detailed by energy source.
- Demand Indicators: Historical data including consumption per inhabitant, consumption trends, total consumption by energy source, final consumption by energy source and sector, and electricity consumption by sector.
- Energy Balances: Single table displaying the overall energy industry balance per annum, also graphically displayed by energy sub-segment.
The Netherlands energy market data since 1990 and up to
is included in the Excel file accompanying the Netherlands country report.
It showcases the historical evolution, allowing users to easily work with the data.
Key Data included in the excelsheet:
- Economic indicators: Annual historical economic indicators, energy security, energy efficiency and CO2 emissions.
- Supply indicators: Annual historical reserves, capacity, production and external trade (imports(+) exports(-) balance).
- Demand indicators: Annual historical consumption per capita, consumption trends, total consumption, final consumption (per energy and per sector) and electricity consumption total and per sector.
- Energy Balance: total and per energy.
- Netherlands Energy Prices: In addition to the analysis provided on the report we also provided a data set which includes historical details on the Netherlands energy prices for the follow items: price of premium gasoline (taxes incl.), price of diesel (taxes incl.), price of electricity in industry (taxes incl.), price of electricity for households (taxes incl.), price of natural gas in industry (taxes incl.), prices of natural gas for households (taxes incl.), spot price of Brent and CO2 emissions (from fuel combustion).
The Netherlands country dashboards are complemented with country forecasts from EnerFuture (excel file) with scenario comparison.
Data included in the excelsheet:
- Demand: Primary energy consumption, final energy consumption, by fuel, by sector.
- Power: Electricity generation & capacities, by technology.
- CO2: Total CO2 emissions.
- Macro-economy: Main macro-economic assumptions.
- Key indicators: Energy intensity, share of renewables, CO2 emissions per capita and per unit of GDP.