Iran Key Figures
- Population:
- 91.6 million
- GDP growth rate:
- 3.04 %/year
- Energy independence:
- 100%
Data of the last year available: 2024
- Total consumption/GDP:*
- 100 (2015=100)
- CO2 Emissions:
- 8.04 tCO2/cap
- Rate of T&D power losses:
- 10.4%
* at purchasing power parity
View all macro and energy indicators in the Iran energy report
Iran Energy News
View all news, archive your new and create your own daily newsletters only on your topics/countries of interest with Key Energy Intelligence
Iran Energy Research
- Iran's Energy & Climate Policy Framework: Iran's energy sector is dominated by hydrocarbons, with renewables lagging behind targets. The country faces sanctions, economic challenges, and aims to boost oil and gas production while expanding renewables and energy efficiency. It has not ratified the Paris Agreement.
- Iran's Energy Companies: Iran's energy sector is state-controlled, with Tavanir, TPPH, and WRM overseeing electricity, while NIOC manages oil and gas. Sanctions have impacted foreign investment, particularly in gas projects like South Pars.
- Iran's Energy Supply & Demand: Iran, with the world's second-largest gas and third-largest oil reserves, sees rapid energy growth. Gas dominates supply (71%) and power generation (80%), with consumption rising 3% annually. Oil production has rebounded post-sanctions, while gas exports target Iraq and Turkey. Electricity demand grows at 4.5% yearly, primarily met by gas-fired plants. Despite vast reserves, flaring and inefficiencies persist, contributing to rising GHG emissions.
- Iran's Energy Use & Price by Sector: Iran's energy demand growth has slowed since 2019, with gas as the primary source. Residential, services, and agriculture sectors lead consumption, followed by industry and transport. Authorities set low energy prices, particularly for electricity and fuel, due to currency depreciation.
- Iran's Issues & Prospects: Iran aims to boost gas production by 50% by 2029, with significant investments in gas, nuclear, and renewable energy projects, despite sanctions. Key developments include new gas-fired and nuclear power plants, as well as solar and wind projects. Oil and LNG projects face delays due to sanctions and funding constraints.
Benefit from up to 2 000 up-to-date data series for 186 countries in Global Energy & CO2 data
A data overview is available in the global energy statistics app
Iran Total Energy Production & Consumption
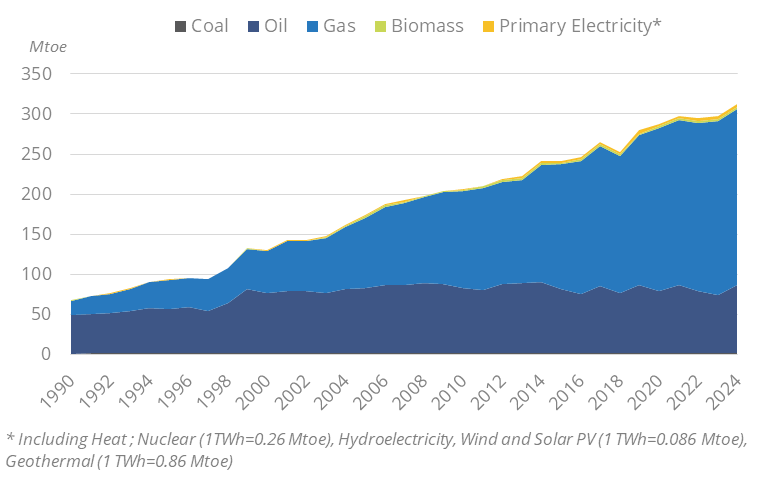
Energy consumption is increasing rapidly (3%/year since 2010) and stood at 313 Mtoein 2024. Per capita energy consumption stands at 3.4 toe (similar to that in the Middle East or the EU average)
Gas dominates the energy mix (71% in 2024), followed by oil (27%). The share of gas has increased by 12 points since 2010. Primary electricity (mainly hydro) is marginal (1%).
Graph: Primary Consumption Trends by Energy Source
Source: Iran energy report
Interactive Chart Iran Total Energy Production & Consumption
Source: Global Energy & CO2 data
Benefit from up to 2 000 up-to-date data series for 186 countries in Global Energy & CO2 data
View the detailed fondamentals of the market at country level (graphs, tables, analysis) in the Iran energy report
Iran Oil Production & Consumption
Oil production has increased rapidly since 2020 (11%/year), reaching 190 Mt in 2024, after a significant decrease over 2010-2020 (-5%/year) because of international sanctions and COVID in 2020. Average crude oil production reached about 4.15 mb/d in FY 2025, according to the Ministry of Oil.
Previously, it had dropped by 5.5%/year between 2010 and 2015 to 162 Mt, because of international sanctions. It increased by 32% in 2016 after the lifting of those sanctions and reached a peak at 220 Mt in 2017, above its 2000-2010 average (around 215 Mt).
Source: Iran energy report
Interactive Chart Iran Crude Oil Production & Consumption
Source: Global Energy & CO2 data
Interactive Chart Iran Refined Oil Products Production & Consumption
Source: Global Energy & CO2 data
Benefit from up to 2 000 up-to-date data series for 186 countries in Global Energy & CO2 data
Additionally, for more detailed information on refineries, you can request a sample of our EMEA Refineries Dataset
Iran Natural Gas Production & Consumption
Gas production is increasing rapidly and regularly (5.4%/year since 2010) and reached 285 bcm in 2024. It has more than quadrupled since 2000 (61 bcm). It is primarily intended for the domestic market (over 90% of the total gas production).
Source: Iran energy report
Interactive Chart Iran Gas Production & Consumption
Source: Global Energy & CO2 data
Benefit from up to 2 000 up-to-date data series for 186 countries in Global Energy & CO2 data
Additionally, for more detailed information on the LNG trade, you can request a sample of our EMEA LNG Trade Dataset
Iran Coal and Lignite Production & Consumption
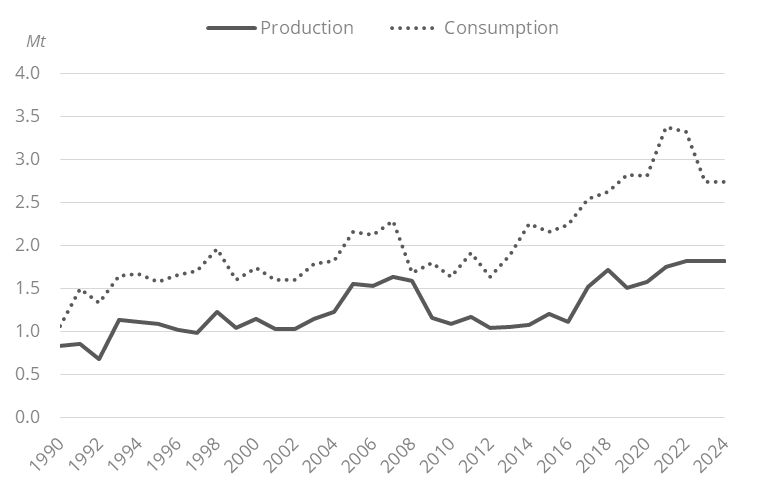
Coal consumption is low and has been quite stable since 2017 (about 2.8 Mt on average). Most consumption is concentrated in industry (>40%). Only two thirds of coal consumption is covered by domestic production. Most consumption is concentrated in industry (>40%).
Graph: Coal Production & Consumption
Source: Iran energy report
Interactive Chart Iran Coal and Lignite Production & Consumption
Source: Global Energy & CO2 data
Benefit from up to 2 000 up-to-date data series for 186 countries in Global Energy & CO2 data
View the detailed consumption trends at country level (graphs, tables, analysis) in the Iran energy report
Iran Renewable in % Electricity Production
Before its integration into SATBA, SUNA (Iran Renewable Energy Organization) was the regulatory authority overseeing renewable policy development and renewable project licensing and securing power purchase agreements (PPAs) with renewable power producers.
In the 6th Plan, the country aimed at reaching 4.5 GW of wind and 0.5 GW of solar capacities by 2021, with an additional 2.5 GW by 2030. The 2021 targets were missed by far. As of 2024, only 350 MW of wind and 1 GW of solar are in operation.
Source: Iran energy report
Interactive Chart Iran Share of Renewables in Electricity Production (incl hydro)
Source: Global Energy & CO2 data
Benefit from up to 2 000 up-to-date data series for 186 countries in Global Energy & CO2 data
Iran GHG emissions and CO2 emissions
Because of the economic sanctions, Iran has not ratified the Paris Agreement and has not submitted its NDC. In its INDC (2015), Iran committed to reducing its GHG emissions by 4% (unconditional pledge) and up to 12% (conditional on international financial and technical assistance) by 2030 compared to a BAU scenario.
Source: Iran energy report
Interactive Chart Iran CO2 emissions
Source: Global Energy & CO2 data
Benefit from up to 2 000 up-to-date data series for 186 countries in Global Energy & CO2 data
View the detailed consumption trends at country level (graphs, tables, analysis) in the Iran energy report