
- Update
- Format
- 3 files (PDF report, 2 Excel files)
- Pages
-
56 (Report only)
- Delivery
- Immediate by e-mail
- GENERAL OVERVIEW
- ENERGY AND CLIMATE POLICY FRAMEWORK
- ENERGY COMPANIES
- ENERGY SUPPLY AND DEMAND
- ENERGY USE AND PRICE BY SECTOR
- ISSUES AND PROSPECTS
- STATISTICS
- ABBREVIATIONS
- GLOSSARY
Buy Iran energy report
Price without VAT. Depending on your status and location, VAT might be applicable. Get in touch with us for more information.
After validation, you will immediately receive 3 files by email (one pdf report and 2 excel files containing the datasets).
Overview
Iran’s energy sector remains heavily reliant on hydrocarbons, with gas dominating both production and consumption. Despite ambitious renewable targets, progress has been slow, hindered by sanctions and economic challenges. State-owned entities oversee key sectors, while international partnerships face persistent geopolitical constraints.
Get more details on the table of contents and data files, as well as the list of graphs and tables by browsing the tabs below.
Highlights
- Renewables are developing slower than expected.
- Iran is the world's 6th largest CO2 emitter and has not ratified the Paris agreement.
- The power sector is controlled by state-owned companies Tavanir, TPPH, and WRM.
- Iran has the world's second largest gas reserves and third largest oil reserves.
- Gas production is increasing rapidly (5%/year since 2010).
- Natural gas dominates the power mix (84%).
- Diesel and gasoline prices are among the lowest in the world despite several adjustments.
- Investments in new infrastructures have been significantly affected by international sanctions.
- The country aims to boost its gas production by 50% by 2029.
- Around 12 GW of gas capacity is under construction.
Energy & Climate Policy Framework
The Ministry of Petroleum is responsible for the entire hydrocarbon sector: oil, gas, refining, and petrochemicals. The Ministry of Energy is in charge of the electricity sector and oversees the energy efficiency and renewables policy.
Energy Companies
Gas:
NIOC oversees gas exploration and production. NIGEC (National Iranian Gas Export Company), a subsidiary of the national gas company NIGC (National Iranian Gas Company), oversees the sale of gas abroad.
Energy Supply & Demand
Resources:
Iran has the world's second largest gas reserves (behind Russia), amounting to about 34 000 bcm, i.e. 16% of the world's total conventional gas reserves (end of 2024). Most of those reserves have not yet been exploited because they are not linked to oil fields (non-associated gas), and because two thirds are located in offshore fields.
Energy Use and Price by Sector
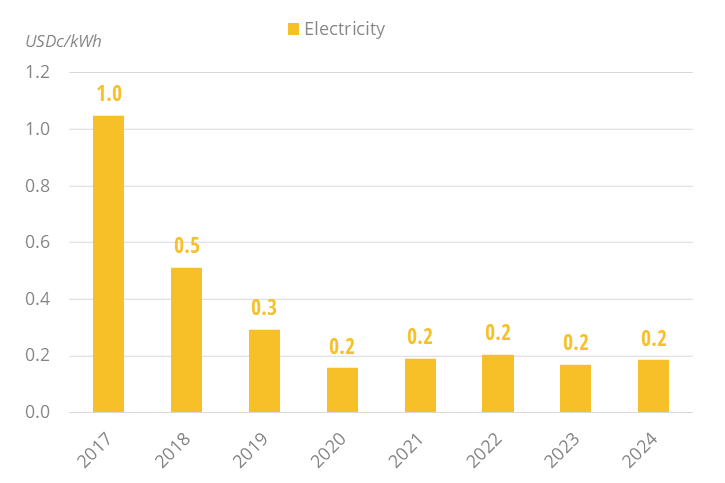
Energy Prices in Residential:
Prices are set by the authorities. Electricity prices for households have collapsed since 2019 (~US$0.2c/kWh). This is partly due to the depreciation of the IRR against USD.
Graph: Energy Prices in Residential (Taxes Included)
Issues & Prospects
Iran aims to develop its hydrocarbon resources, particularly its gas exports.
- Graph 1: Primary Consumption Trends by Energy Source
- Graph 2: Total Consumption Market Share by Energy (2024)
- Graph 3: Installed Electric Capacity by Source
- Graph 4: Installed Electric Capacity by Source (2024)
- Graph 5: Gross Power Production by Source & Consumption
- Graph 6: Power Generation by Source (2024)
- Graph 7: Crude Oil Production & Consumption
- Graph 8: Petroleum Products Production & Consumption
- Graph 9: Gas Production & Consumption
- Graph 10: Coal Production & Consumption
- Graph 11: Emissions of GHG and CO2 from Fuel Combustion
- Graph 12: Final Demand Trends by Energy Source
- Graph 13: Final Consumption by Sector
- Graph 14: Final Consumption Market Share by Sector (2024)
- Graph 15: Final Consumption in Industry by Energy Source
- Graph 16: Energy Prices in Industry (Taxes Included)
- Graph 17: Final Consumption in Transport by Energy Source
- Graph 18: Energy Prices in Transport (Taxes Included)
- Graph 19: Final Consumption in Residential, Services, Agriculture by Energy Source
- Graph 20: Energy Prices in Residential (Taxes Included)
- Graph 21: Upcoming New Capacity by Energy Source
- Economic Indicators: Annual historical data including population, GDP growth, imports and exports, inflation rate, energy security and efficiency indicators, CO2 emissions.
- Supply Indicators: Historical data including oil and gas reserves, electric and refining capacity, energy production, power production and external trade. All are detailed by energy source.
- Demand Indicators: Historical data including consumption per inhabitant, consumption trends, total consumption by energy source, final consumption by energy source and sector, and electricity consumption by sector.
- Energy Balances: Single table displaying the overall energy industry balance per annum, also graphically displayed by energy sub-segment.
The Iran energy market data since 1990 and up to
is included in the Excel file accompanying the Iran country report.
It showcases the historical evolution, allowing users to easily work with the data.
Key Data included in the excelsheet:
- Economic indicators: Annual historical economic indicators, energy security, energy efficiency and CO2 emissions.
- Supply indicators: Annual historical reserves, capacity, production and external trade (imports(+) exports(-) balance).
- Demand indicators: Annual historical consumption per capita, consumption trends, total consumption, final consumption (per energy and per sector) and electricity consumption total and per sector.
- Energy Balance: total and per energy.
- Iran Energy Prices: In addition to the analysis provided on the report we also provided a data set which includes historical details on the Iran energy prices for the follow items: price of premium gasoline (taxes incl.), price of diesel (taxes incl.), price of electricity in industry (taxes incl.), price of electricity for households (taxes incl.), price of natural gas in industry (taxes incl.), prices of natural gas for households (taxes incl.), spot price of Brent and CO2 emissions (from fuel combustion).