India Key Figures
- Population:
- 1464 million
- GDP growth rate:
- 7.62 %/year
- Energy independence:
- 65.0%
Data of the last year available: 2025
- Total consumption/GDP:*
- 79.0 (2015=100)
- CO2 Emissions:
- 2.25 tCO2/cap
- Rate of T&D power losses:
- 15.5%
* at purchasing power parity
View all macro and energy indicators in the India energy report
India Energy News
View all news, archive your new and create your own daily newsletters only on your topics/countries of interest with Key Energy Intelligence
India Energy Research
- India's Energy & Climate Policy Framework: India is aggressively pursuing energy transition, aiming for carbon neutrality by 2070. Key strategies include expanding renewables, scaling green hydrogen, nuclear growth, and market liberalisation.
- India's Energy Companies: India’s energy sector is defined by significant state-owned dominance in fossil fuel production and infrastructure, alongside a growing private sector presence in power generation and renewables.
- India's Energy Supply & Demand: India’s energy sector remains coal-reliant, accounting for 47% of supply and 68% of power generation. While renewables are expanding rapidly, rising demand drives significant fossil fuel imports.
- India's Energy Use & Price by Sector: Final energy consumption continues to rise, driven by industry and transport. While oil dominates transport, gas prices have fallen, and electricity prices remain largely stable across sectors.
- India's Issues & Prospects: India is balancing rising energy demand and import reduction by expanding renewable, nuclear, and coal capacities, whilst investing heavily in infrastructure to reach its 2030 energy targets.
Benefit from up to 2 000 up-to-date data series for 186 countries in Global Energy & CO2 data
A data overview is available in the global energy statistics app
India Total Energy Production & Consumption
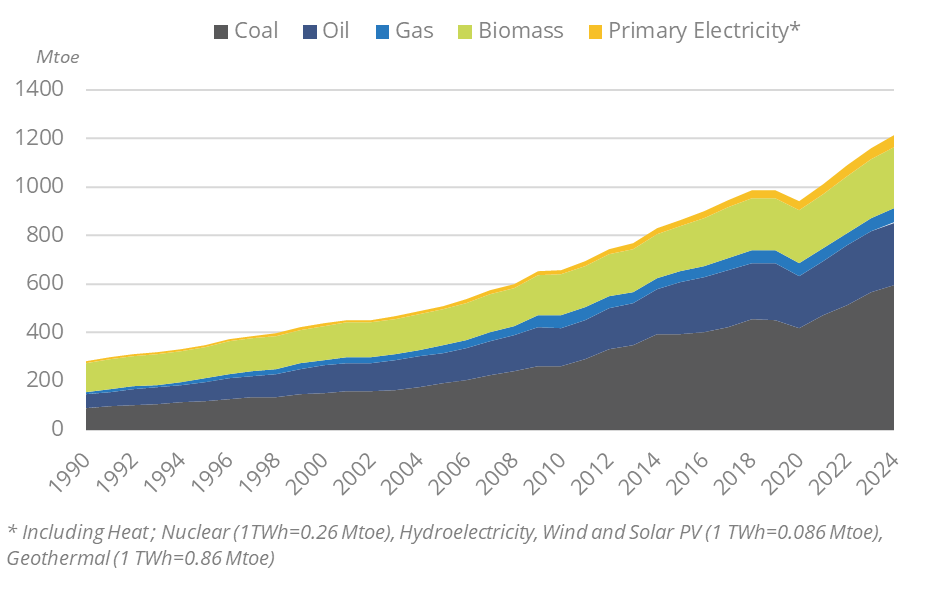
Primary consumption only increased by 1% in 2025, reaching 1 213 Mtoe, after growth by 6.2%/year between 2020 and 2024 and by 4.6%/year over 2010-2019. Total energy consumption per capita reached 0.8 toe (2025), half the Asian average.
Graph: Primary Consumption Trends by Energy Source
Source: India energy report
Interactive Chart India Total Energy Production & Consumption
Source: Global Energy & CO2 data
Benefit from up to 2 000 up-to-date data series for 186 countries in Global Energy & CO2 data
View the detailed fondamentals of the market at country level (graphs, tables, analysis) in the India energy report
India Oil Production & Consumption
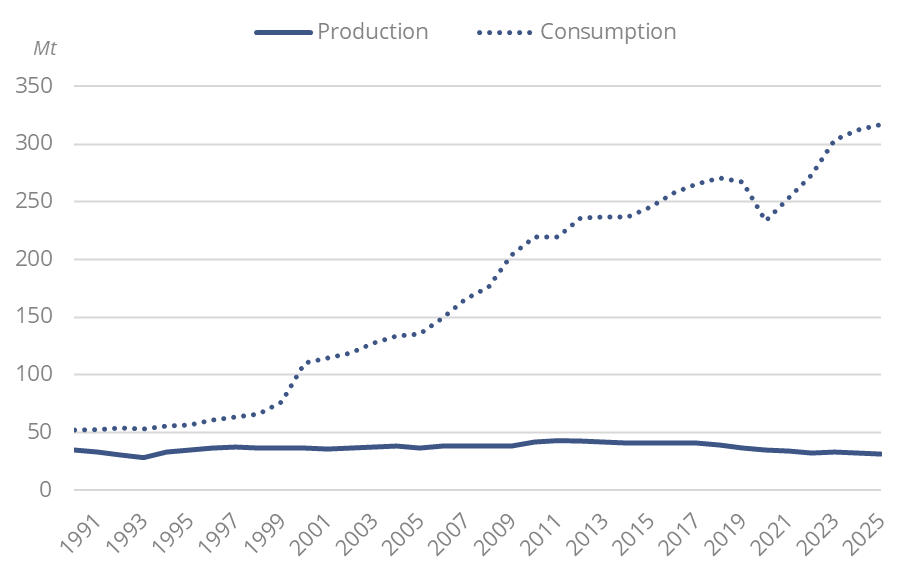
Oil production has declined by 3.4% since 2017 to 31 Mt in 2025.
India is the world's third largest importer of crude oil, reaching its highest level in 2025 at 270 Mt (+3.4%/year since 2010). In 2025, crude oil imports represented 85% of the country's oil needs.
Graph: Crude Oil Production & Consumption
Source: India energy report
Interactive Chart India Crude Oil Production & Consumption
Source: Global Energy & CO2 data
Interactive Chart India Refined Oil Products Production & Consumption
Source: Global Energy & CO2 data
Benefit from up to 2 000 up-to-date data series for 186 countries in Global Energy & CO2 data
Additionally, for more detailed information on refineries, you can request a sample of our Asia Refineries Dataset
India Natural Gas Production & Consumption
Natural gas production decreased in 2025 (-3.6%), reaching 35 bcm, following a strong growth between 2020 and 2024 (6.4%/year), and a decline by 6%/year from 2010 to 2020.
In 2020, ONGC began to produce gas from the KG-DWN98/2 block (Cluster 2 project) in the Bay of Bengal. The US$5.1bn project is forecast to provide up to 17 mcm/d of gas (6.2 bcm/year). Production from the deepest well U1B started at the end of 2021.
Gas production covered 47% of the consumption in 2025. Gas imports (100% LNG) reached 32 bcm in 2025 (-2.6%).
Source: India energy report
Interactive Chart India Gas Production & Consumption
Source: Global Energy & CO2 data
Benefit from up to 2 000 up-to-date data series for 186 countries in Global Energy & CO2 data
Additionally, for more detailed information on the LNG trade, you can request a sample of our Asia LNG Trade Dataset
India Coal and Lignite Production & Consumption
Total coal and lignite production decreased by 1% in 2025 to 1.1 Gt, after a very rapid growth between 2020 and 2024 (+10%/year), and a more moderate progression over 2015-2020 (around 2%/year).
Source: India energy report
Interactive Chart India Coal and Lignite Production & Consumption
Source: Global Energy & CO2 data
Benefit from up to 2 000 up-to-date data series for 186 countries in Global Energy & CO2 data
View the detailed consumption trends at country level (graphs, tables, analysis) in the India energy report
India Renewable in % Electricity Production
IREDA, the Indian Renewable Energy Development Agency, finances the development of renewables.
Source: India energy report
Interactive Chart India Share of Renewables in Electricity Production (incl hydro)
Source: Global Energy & CO2 data
Benefit from up to 2 000 up-to-date data series for 186 countries in Global Energy & CO2 data
India GHG emissions and CO2 emissions
In its new NDC until 2035 (April 2026), the country aims to reduce its CO2 emission intensity of GDP by 47% in 2035, compared to 2005 levels and reaffirms its goal to reachnet-zero emissions in 2070.
In its Union Budget 2026-27, India proposes a INR 20 000 crore (US$2.2 bn) outlay over five years to scale up CCUS technologies. This funding targets commercial readiness in power, refining, and hard-to-abate sectors (steel, cement, chemicals), which is aligned with the national CCUS R&D roadmap released in December 2025.
Source: India energy report
Interactive Chart India CO2 emissions
Source: Global Energy & CO2 data
Benefit from up to 2 000 up-to-date data series for 186 countries in Global Energy & CO2 data
View the detailed consumption trends at country level (graphs, tables, analysis) in the India energy report