
- Update
-
- Format
- 4 files (PDF report, 3 Excel files)
- Pages
-
80 (Report only)
- Delivery
- Immediate by e-mail
- GENERAL OVERVIEW
- ENERGY AND CLIMATE POLICY FRAMEWORK
- ENERGY COMPANIES
- ENERGY SUPPLY AND DEMAND
- ENERGY USE AND PRICE BY SECTOR
- ISSUES AND PROSPECTS
- STATISTICS
- ABBREVIATIONS
- GLOSSARY
Buy India energy report
Price without VAT. Depending on your status and location, VAT might be applicable. Get in touch with us for more information.
After validation, you will immediately receive 4 files by email (one pdf report and 3 excel files containing the datasets).
Overview
India is advancing a comprehensive energy transition through ambitious non-fossil fuel capacity targets, liberalised markets, and significant investments in renewables and nuclear. The nation aims to balance rapidly rising energy demand with long-term carbon neutrality goals.
Get more details on the table of contents and data files, as well as the list of graphs and tables by browsing the tabs below.
Highlights
- The country aims to reach 60% of non-fossil fuel capacity in 2035, after achieving its 2030 target of 50% in 2025. It pledges to reduce by 45% in carbon intensity in 2030 compared to 2005 and to reach carbon-neutrality by 2070.
- Fossil fuel production is dominated by state-owned companies: CIL for coal and ONGC for gas and oil. Private companies own more than half of power capacity.
- Coal production reached its highest level in 2024. It supplies around 70% of electricity generation. Around 130 GW of solar has been installed since 2016.
- Final energy consumption continues to increase rapidly (+3.5%/year since 2010). Gas prices started to decrease in 2024, after reaching their highest level in 2023, while electricity prices are rather stable.
- Power production is expected to grow by around 5%/year by 2031, with the share of coal decreasing to 50% and renewables filling most of the gap (44%). The country plans to add 97 GW of coal-fired capacity by 2035. Green hydrogen production is expected to reach 5 Mt in 2030.
Energy & Climate Policy Framework
The management of the energy sector is split between several ministries: the Ministry of Power (MoP) for electricity and the coordination of energy conservation programmes; the Ministry of Petroleum and Natural Gas (MoPNG); the Ministry of Coal supervisescoal exploration and extraction; and, finally, the Ministry of New and Renewable Energy (MNRE).
Energy Companies
Gas:
ONGC is the main gas producer, with 55% of total production (19.5 bcm in FY2025-26), of which 17% comes from new well gas.
Energy Supply & Demand
Gas:
Natural gas production decreased in 2025 (-3.6%), reaching 35 bcm, following a strong growth between 2020 and 2024 (6.4%/year), and a decline by 6%/year from 2010 to 2020.
Energy Use and Price by Sector
Energy Prices in Residential:
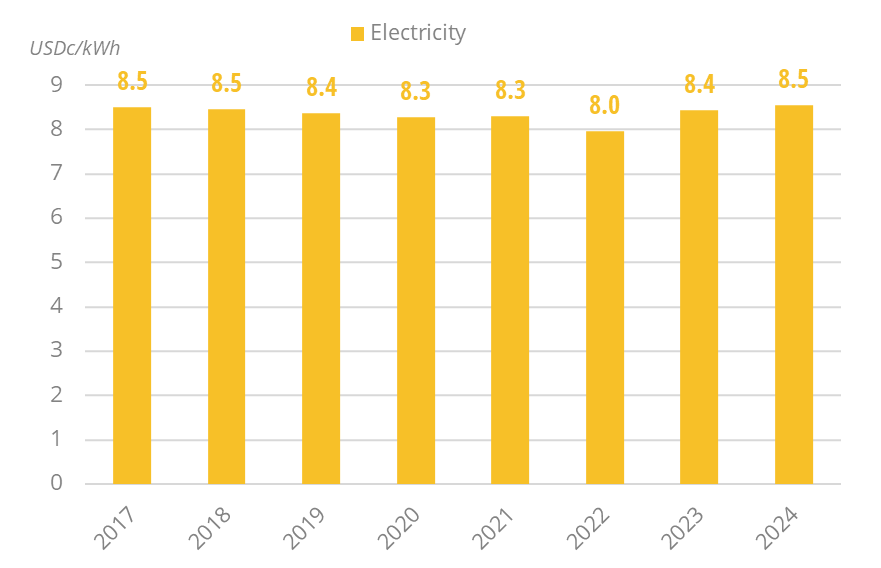
Electricity prices for households are roughly stable over the last years (US$8.4c/kWh in 2025). It had been lower in 2022 (US$8c/kWh).
Graph: Energy Prices in Residential (Taxes Included)
Issues & Prospects
The energy sector is faced with several challenges: the level of oil production is low, while the consumption is rising sharply, leading to more imports. In both oil and gas sectors, sizeable investments are needed to increase energy production and improve infrastructure, especially for supporting larger imports.
- Graph 1: Final Intensity to GDP
- Graph 2: Primary Consumption Trends by Energy Source
- Graph 3: Total Consumption Market Share by Energy (2025)
- Graph 4: Installed Electric Capacity by Source
- Graph 5: Installed Electric Capacity by Source (2025)
- Graph 6: Gross Power Production by Source & Consumption
- Graph 7: Power Generation by Source (2025)
- Graph 8: CO2 Intensity of Electricity Generation
- Graph 9: Crude Oil Production & Consumption
- Graph 10: Petroleum Products Production & Consumption
- Graph 11: Gas Production & Consumption
- Graph 12: Coal Production & Consumption
- Graph 13: GHG Emissions and CO2-energy Emissions
- Graph 14: CO2-Emissions per Capita
- Graph 15: CO2 Intensity to GDP
- Graph 16: Final Demand Trends by Energy Source
- Graph 17: Final Consumption by Sector
- Graph 18: Final Consumption Market Share by Sector (2025)
- Graph 19: Share of Electricity in Total Final Energy Consumption
- Graph 20: Final Consumption in Industry by Energy Source
- Graph 21: Energy Prices in Industry (Taxes Included)
- Graph 22: Final Consumption in Transport by Energy Source
- Graph 23: Energy Prices in Transport (Taxes Included)
- Graph 24: Final Consumption in Residential, Services, Agriculture by Energy Source
- Graph 25: Energy Prices in Residential (Taxes Included)
- Graph 26: Upcoming New Capacity by Energy Source
- Economic Indicators: Annual historical data including population, GDP growth, imports and exports, inflation rate, energy security and efficiency indicators, CO2 emissions.
- Supply Indicators: Historical data including oil and gas reserves, electric and refining capacity, energy production, power production and external trade. All are detailed by energy source.
- Demand Indicators: Historical data including consumption per inhabitant, consumption trends, total consumption by energy source, final consumption by energy source and sector, and electricity consumption by sector.
- Energy Balances: Single table displaying the overall energy industry balance per annum, also graphically displayed by energy sub-segment.
The India energy market data since 1990 and up to
is included in the Excel file accompanying the India country report.
It showcases the historical evolution, allowing users to easily work with the data.
Key Data included in the excelsheet:
- Economic indicators: Annual historical economic indicators, energy security, energy efficiency and CO2 emissions.
- Supply indicators: Annual historical reserves, capacity, production and external trade (imports(+) exports(-) balance).
- Demand indicators: Annual historical consumption per capita, consumption trends, total consumption, final consumption (per energy and per sector) and electricity consumption total and per sector.
- Energy Balance: total and per energy.
- India Energy Prices: In addition to the analysis provided on the report we also provided a data set which includes historical details on the India energy prices for the follow items: price of premium gasoline (taxes incl.), price of diesel (taxes incl.), price of electricity in industry (taxes incl.), price of electricity for households (taxes incl.), price of natural gas in industry (taxes incl.), prices of natural gas for households (taxes incl.), spot price of Brent and CO2 emissions (from fuel combustion).
The India country dashboards are complemented with country forecasts from EnerFuture (excel file) with scenario comparison.
Data included in the excelsheet:
- Demand: Primary energy consumption, final energy consumption, by fuel, by sector.
- Power: Electricity generation & capacities, by technology.
- CO2: Total CO2 emissions.
- Macro-economy: Main macro-economic assumptions.
- Key indicators: Energy intensity, share of renewables, CO2 emissions per capita and per unit of GDP.