Czechia Key Figures
- Population:
- 10.9 million
- GDP growth rate:
- 2.55 %/year
- Energy independence:
- 58.7%
Data of the last year available: 2025
- Total consumption/GDP:*
- 74.7 (2015=100)
- CO2 Emissions:
- 6.91 tCO2/cap
- Rate of T&D power losses:
- 5.14%
* at purchasing power parity
View all macro and energy indicators in the Czechia energy report
Czechia Energy News
View all news, archive your new and create your own daily newsletters only on your topics/countries of interest with Key Energy Intelligence
Czechia Energy Research
- Czech Rep.'s Energy & Climate Policy Framework: Czechia aims for climate neutrality by 2050, targeting 30% renewables by 2030 and a coal phase-out by 2033. Nuclear power is central to the energy mix, supported by extensive modernisation funding.
- Czech Rep.'s Energy Companies: Czechia’s energy sector is dominated by the state-backed ČEZ group, which leads in power generation, distribution, and gas infrastructure following significant recent consolidation and acquisitions.
- Czech Rep.'s Energy Supply & Demand: Czechia is transitioning its energy sector, with nuclear now exceeding coal in power generation. Consumption and emissions are declining, targeting net-zero by 2050 through strategic diversification.
- Czech Rep.'s Energy Use & Price by Sector: Final energy consumption has declined since 2021, reaching 25 Mtoe in 2025. While oil remains dominant, electricity demand is projected to grow significantly, reaching 56% by 2050. Prices are cooling.
- Czech Rep.'s Issues & Prospects: Czechia is transitioning its energy mix, phasing out coal by 2040 in favour of nuclear, renewables and natural gas. Major infrastructure, grid modernisation and hydrogen projects are underway.
Benefit from up to 2 000 up-to-date data series for 186 countries in Global Energy & CO2 data
A data overview is available in the global energy statistics app
Czechia Total Energy Production & Consumption
Since 2010, primary energy consumption has declined by 1%/year on average to 38 Mtoe in 2025. At 3.4 toe per capita in 2024, Czechia's primary energy consumption is 24% higher than the EU average.
Coal and oil each account for about a quarter of total primary energy consumption (42% and 20% share respectively in 2010), followed by primary electricity at 22% (+8 pp since 2010), of which nuclear represents 20% (+7pp). Gas accounts for 16% (-2pp), while biomass makes up 12% (+5 pp).
Graph: Primary Consumption Trends by Energy Source
Source: Czechia energy report
Interactive Chart Czechia Total Energy Production & Consumption
Source: Global Energy & CO2 data
Benefit from up to 2 000 up-to-date data series for 186 countries in Global Energy & CO2 data
View the detailed fondamentals of the market at country level (graphs, tables, analysis) in the Czechia energy report
Czechia Oil Production & Consumption
Oil production is negligible (0.1 Mt in 2025). The country relies almost entirely on imports (around 7 Mt/year since 2010); 42% of crude oil imports came from Russia in 2024 (down from 58% in 2023), 40% from Azerbaijan (up from 27%), 15% from Kazakhstan (up from 10%) and from Norway (2%).
Source: Czechia energy report
Interactive Chart Czechia Crude Oil Production & Consumption
Source: Global Energy & CO2 data
Interactive Chart Czechia Refined Oil Products Production & Consumption
Source: Global Energy & CO2 data
Benefit from up to 2 000 up-to-date data series for 186 countries in Global Energy & CO2 data
Additionally, for more detailed information on refineries, you can request a sample of our EMEA Refineries Dataset
Czechia Natural Gas Production & Consumption
Natural gas production is low (around than 0.2 bcm in 2025).
After a peak at 10 bcm in 2019, gas imports have declined by approximately 6%/year on average, reaching 7 bcm in 2025.
In 2023, Czechia stopped using Russian pipeline gas, replacing it with gas from Norway and from LNG receiving terminals in the Netherlands and Belgium. In 2024, 68% of gas imports came from Norway (down from 87% in 2023) and 32% from Russia (up from 8% in 2023).
Source: Czechia energy report
Interactive Chart Czechia Gas Production & Consumption
Source: Global Energy & CO2 data
Benefit from up to 2 000 up-to-date data series for 186 countries in Global Energy & CO2 data
Additionally, for more detailed information on the LNG trade, you can request a sample of our EMEA LNG Trade Dataset
Czechia Coal and Lignite Production & Consumption
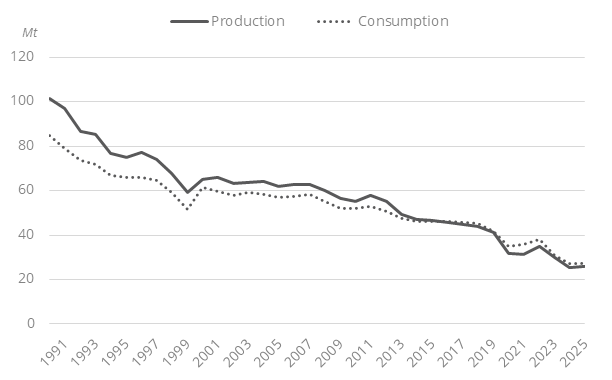
Coal and lignite production has followed a downward trend since 2000, dropping from 65 Mt to 26 Mt in 2025 (-65%, nearly 90% lignite).
About a tenth of coal consumption is imported (3 Mt in 2025).
Coal consumption has followed a trajectory similar to production, declining from 62 Mt in 2000 to 27 Mt in 2025, a decrease of 56%. Most of the coal and lignite is consumed by the power sector (86% in 2025).
Graph: Coal Production & Consumption
Source: Czechia energy report
Interactive Chart Czechia Coal and Lignite Production & Consumption
Source: Global Energy & CO2 data
Benefit from up to 2 000 up-to-date data series for 186 countries in Global Energy & CO2 data
View the detailed consumption trends at country level (graphs, tables, analysis) in the Czechia energy report
Czechia Renewable in % Electricity Production
The final updated NECP (2024) aims to raise the share of renewables in final energy consumption to 30% in 2030. The share of RES in electricity generation is projected to increase to 28% by 2030, and further to 46% by 2050. In the heating sector, the share of RES is expected to 40% in 2030, eventually reaching 74% by 2050. In the transport sector, Czechia has opted for the GHG intensity reduction pathway under RED III, committing to a 14.5% reduction in the carbon intensity of transport fuels by 2030.
Source: Czechia energy report
Interactive Chart Czechia Share of Renewables in Electricity Production (incl hydro)
Source: Global Energy & CO2 data
Benefit from up to 2 000 up-to-date data series for 186 countries in Global Energy & CO2 data
Learn more about renewables in the European Battery Market Analysis
Czechia GHG emissions and CO2 emissions
The NECP (2024) aims to cut GHG emissions by at least 55% by 2030 compared to 1990 levels. The country also aims to cut emissions by 26% by 2030 compared to 2005 levels in non-ETS sectors. Czechia aims to contribute to the climate neutrality by 2050 and reduce the share of fossil fuels (used without capture technology) in primary energy consumption to 50% by 2030 0% in 2050.
Source: Czechia energy report
Interactive Chart Czechia CO2 emissions
Source: Global Energy & CO2 data
Benefit from up to 2 000 up-to-date data series for 186 countries in Global Energy & CO2 data
View the detailed consumption trends at country level (graphs, tables, analysis) in the Czechia energy report