Chad Key Figures
- Population:
- 20.3 million
- GDP growth rate:
- 3.65 %/year
- Energy independence:
- 100%
Data of the last year available: 2024
- Total consumption/GDP:*
- 86.0 (2015=100)
- CO2 Emissions:
- 0.09 tCO2/cap
- Rate of T&D power losses:
- 16.2%
* at purchasing power parity
View all macro and energy indicators in the Chad energy report
Chad Energy News
View all news, archive your new and create your own daily newsletters only on your topics/countries of interest with Key Energy Intelligence
Chad Energy Research
- Chad's Energy & Climate Policy Framework: Chad targets 30% renewable energy in its power mix by 2030, alongside increasing crude oil production. The government aims to modernise the energy sector, enhance electricity access, and promote economic diversification through public-private partnerships.
- Chad's Energy Companies: Chad's STE replaces SNE amid electricity sector reforms. Petronas and ExxonMobil exit Chad's oil sector.
- Chad's Energy Supply & Demand: "Chad's energy mix is dominated by biomass (76%) and oil (24%), with low per capita consumption. Oil production fell 8% in 2024, while electricity relies heavily on oil (99%). Solar potential remains underutilised despite recent additions. Frequent power outages and high losses plague the grid, with limited national connectivity. GHG emissions have doubled since 2010, driven by energy combustion."
- Chad's Energy Use & Price by Sector: In 2024, biomass dominated Chad's energy use (74%), with government-regulated prices. Electricity demand was low (13.5 kWh/capita), while final energy demand rose 32% since 2010. Residential, services, and agriculture sectors led consumption (75%), followed by transport (22%). Government subsidies and tax cuts were introduced to alleviate energy costs.
- Chad's Issues & Prospects: Chad plans a 1,500km Cameroon-Chad power interconnection and 35MW of solar projects. Electricity demand is projected to rise 17% annually, with significant renewable and gas-fired capacity additions.
Benefit from up to 2 000 up-to-date data series for 186 countries in Global Energy & CO2 data
A data overview is available in the global energy statistics app
Chad Total Energy Production & Consumption
The energy consumption per capita in 2024 was around 0.13 toe/cap (4 times lower than the average for Sub-Saharan Africa).
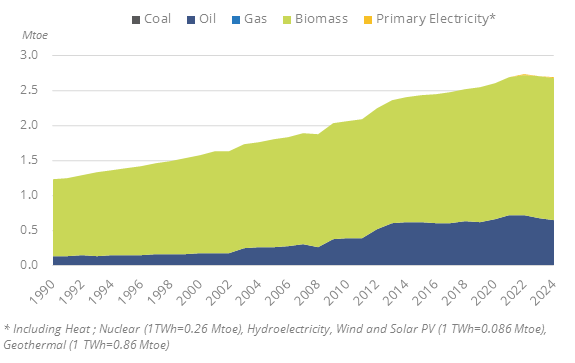
Total primary consumption increased by 30% between 2010 and 2024 as it rose from 2.1 to 2.7 Mtoe. Biomass dominates the energy mix with 76%, followed by oil (24%).
Graph: Primary Consumption Trends by Energy Source
Graph: Total Consumption Market Share by Energy (2024)
Source: Chad energy report
Interactive Chart Chad Total Energy Production & Consumption
Source: Global Energy & CO2 data
Benefit from up to 2 000 up-to-date data series for 186 countries in Global Energy & CO2 data
View the detailed fondamentals of the market at country level (graphs, tables, analysis) in the Chad energy report
Chad Oil Production & Consumption
Oil production fell by 9% in 2024 to 6.8 Mt, after increasing by around 6%/year since 2021, reaching 7.4 Mt in 2023, its highest level in fifteen years. This upward trend follows several years of fluctuation, with production oscillating between 6.5 Mt and 6.9 Mt from 2018 to 2021. Production started in 2003.
About nine tenths of the production is exported (2024). Exports have been primarily destined to Germany (32%), China (22%), France (21%), and the Netherlands (14%).
Source: Chad energy report
Interactive Chart Chad Crude Oil Production & Consumption
Source: Global Energy & CO2 data
Interactive Chart Chad Refined Oil Products Production & Consumption
Source: Global Energy & CO2 data
Benefit from up to 2 000 up-to-date data series for 186 countries in Global Energy & CO2 data
Additionally, for more detailed information on refineries, you can request a sample of our EMEA Refineries Dataset
Chad Renewable in % Electricity Production
The Agency for the Development of Renewable Energies (ADER) is the parastatal in charge of the promotion of renewables. However, its resources, which come from the State budget, are insufficient to ensure its full operationalization.
According to Tchad Connexion 2030, Chad aims to achieve a 20% to 30% share of renewable energy in the energy mix (compared to 9% in 2024). Chad aims to achieve 520 MW of solar power by 2030. In 2024, installed solar capacity was 2 MW.
Source: Chad energy report
Interactive Chart Chad Share of Renewables in Electricity Production (incl hydro)
Source: Global Energy & CO2 data
Benefit from up to 2 000 up-to-date data series for 186 countries in Global Energy & CO2 data
Chad GHG emissions and CO2 emissions
In its updated NDC (2021), the country lowered its GHG emission reduction target from 71% to 19.3% of the BAU projection in 2030. The reduction target is divided into an unconditional target of 0.5% and a conditional target of 18.8%. The emission reduction relies solely on the energy sector (electricity production and energy efficiency), on increasing carbon sinks and, to a very limited extent, on the waste sector. Investments needed to implement NDC mitigation actions are estimated at US$6.7bn.
Source: Chad energy report
Interactive Chart Chad CO2 emissions
Source: Global Energy & CO2 data
Benefit from up to 2 000 up-to-date data series for 186 countries in Global Energy & CO2 data
View the detailed consumption trends at country level (graphs, tables, analysis) in the Chad energy report