
- Update
-
- Format
- 3 files (PDF report, 2 Excel files)
- Pages
-
56 (Report only)
- Delivery
- Immediate by e-mail
- GENERAL OVERVIEW
- ENERGY AND CLIMATE POLICY FRAMEWORK
- ENERGY COMPANIES
- ENERGY SUPPLY AND DEMAND
- ENERGY USE AND PRICE BY SECTOR
- ISSUES AND PROSPECTS
- STATISTICS
- ABBREVIATIONS
- GLOSSARY
Buy Bangladesh energy report
Price without VAT. Depending on your status and location, VAT might be applicable. Get in touch with us for more information.
After validation, you will immediately receive 3 files by email (one pdf report and 2 excel files containing the datasets).
Overview
Bangladesh’s energy strategy balances ambitious renewable expansion with fossil fuel reliance, targeting 40% clean energy by 2041 while scaling gas, coal, and nuclear capacity. Regulatory bodies oversee sector reforms, private investment incentives, and efficiency drives amid rising demand and infrastructure challenges.
Get more details on the table of contents and data files, as well as the list of graphs and tables by browsing the tabs below.
Highlights
- Bangladesh targets 20% of its electricity demand covered by renewables in 2030 and an unconditional 6% reduction in GHG emissions by 2035.
- Private companies own half of the electricity capacity.
- Chevron is the main gas producer, with around 60% of total output.
- The large gas resources are not well developed and are insufficient to meet the growing demand.
- Gas dominates the power mix (77% in 2024).
- Energy consumption is increasing two times slower than the economic growth.
- Energy prices are controlled and subsidised by the Government.
- The country targets a tripling of power capacity by 2040.
- In 2021, the Government cancelled 10 coal-fired power plants totalling around 9 GW.
Energy & Climate Policy Framework
The Ministry of Power, Energy, and Mineral Resources (MPEMR) is responsible for the energy sector. Its Energy and Mineral Resources Division (EMRD) is responsible for energy-related policies through the implementation of energy plans.
The Ministry of Finance approves the investments in the energy sector.
Energy Companies
Gas:
Chevron is the main gas producer, accounting for around 58% of total natural gas production in 2024-2025. It is active in three fields, namely Bibiyana, Maulavi Bazar, and Jalalabad. Bibiyana, in operation since 2007, is the largest producing field, accounting for almost 37% of total production.
Energy Supply & Demand
Oil:
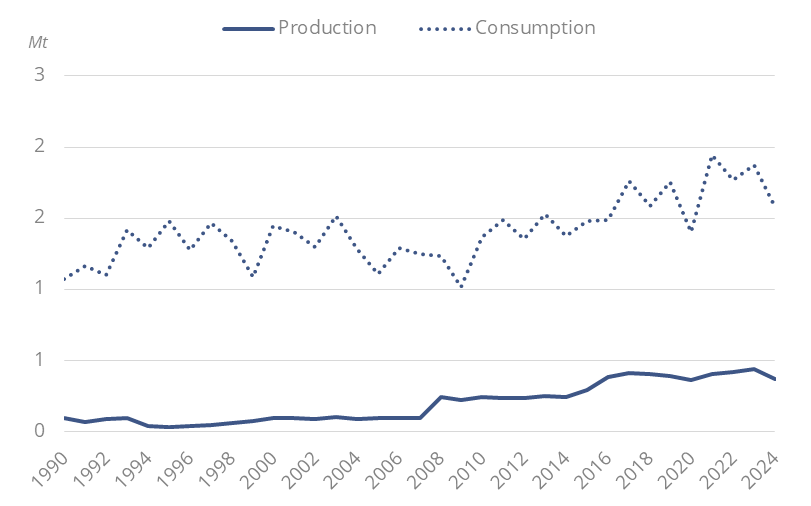
Bangladesh's crude oil production is limited (below 0.5 Mt in 2024), covering less than ¼ of its domestic demand. The country imports 4 times its oil production (1.4 Mt of imports for a production of 0.4 Mt in 2024).
Graph: Crude Oil Production & Consumption
Energy Use and Price by Sector
Energy Prices in Industry:
Energy prices are regulated by the Bangladesh Energy Regulatory Commission (BERC). In January 2023, it announced a 179% increase in gas prices for industry, in an attempt to curb subsidies and to reduce the fiscal deficit. A new 33% increase in industrial gas prices was announced in April 2025.
Issues & Prospects
Electricity:
IEPMP The Integrated Energy and Power Master Plan 2023 foresees a capacity of 52.6 GW in 2030, 86 GW in 2041, and 138 GW in 2050 in the ATS scenario (Advanced Technology), gas capacity accounts for the largest share until 2041 (25 GW, 42 GW).
- Graph 1: Primary Consumption Trends by Energy Source
- Graph 2: Total Consumption Market Share by Energy (2024)
- Graph 3: Installed Electric Capacity by Source
- Graph 4: Installed Electric Capacity by Source (2024)
- Graph 5: Gross Power Production by Source & Consumption
- Graph 6: Power Generation by Source (2024)
- Graph 7: Crude Oil Production & Consumption
- Graph 8: Petroleum Products Production & Consumption
- Graph 9: Gas Production & Consumption
- Graph 10: Coal Production & Consumption
- Graph 11: Emissions of GHG and CO2 from Fuel Combustion
- Graph 12: Final Demand Trends by Energy Source
- Graph 13: Final Consumption by Sector
- Graph 14: Final Consumption Market Share by Sector (2024)
- Graph 15: Final Consumption in Industry by Energy Source
- Graph 16: Energy Prices in Industry (Taxes Included)
- Graph 17: Final Consumption in Transport by Energy Source)
- Graph 18: Energy Prices in Transport (Taxes Included)
- Graph 19: Final Consumption in Residential, Services, Agriculture by Energy Source
- Graph 20: Energy Prices in Residential (Taxes Included)
- Graph 21: Upcoming New Capacity by Energy Source
L
- Economic Indicators: Annual historical data including population, GDP growth, imports and exports, inflation rate, energy security and efficiency indicators, CO2 emissions.
- Supply Indicators: Historical data including oil and gas reserves, electric and refining capacity, energy production, power production and external trade. All are detailed by energy source.
- Demand Indicators: Historical data including consumption per inhabitant, consumption trends, total consumption by energy source, final consumption by energy source and sector, and electricity consumption by sector.
- Energy Balances: Single table displaying the overall energy industry balance per annum, also graphically displayed by energy sub-segment.
The Bangladesh energy market data since 1990 and up to
is included in the Excel file accompanying the Bangladesh country report.
It showcases the historical evolution, allowing users to easily work with the data.
Key Data included in the excelsheet:
- Economic indicators: Annual historical economic indicators, energy security, energy efficiency and CO2 emissions.
- Supply indicators: Annual historical reserves, capacity, production and external trade (imports(+) exports(-) balance).
- Demand indicators: Annual historical consumption per capita, consumption trends, total consumption, final consumption (per energy and per sector) and electricity consumption total and per sector.
- Energy Balance: total and per energy.
- Bangladesh Energy Prices: In addition to the analysis provided on the report we also provided a data set which includes historical details on the Bangladesh energy prices for the follow items: price of premium gasoline (taxes incl.), price of diesel (taxes incl.), price of electricity in industry (taxes incl.), price of electricity for households (taxes incl.), price of natural gas in industry (taxes incl.), prices of natural gas for households (taxes incl.), spot price of Brent and CO2 emissions (from fuel combustion).