This analysis has been written by Patrick Criqui member of Enerdata’s Expert Panel and Senior Researcher at CNRS. Oil less than 30 dollars per barrel ($/bl)! No market observer would have thought this possible after only one year. Just as in 1998, it was thought that oil (then $20/bl) wouldn’t exceed $30: 10 years later, it was more than $110 on annual average after peaking at $147 following the economic crisis in 2008! Because changes in oil prices systematically differ from forecasts, the big temptation is to consider them as irrational or purely subject to geopolitical risks or even the result of more financial considerations in oil markets. All of this is true, but only in a very small part. Looking back, it seems that these changes, which will always remain unpredictable, can nevertheless be explained by market fundamentals and by several characteristics of the economy of natural resources. To do this, we must first refer to a very simple equation linking global oil demand and two major product categories: OPEC production and non OPEC production. We must then study the dynamics of these variables over a sufficiently long period of time, say 50 years. We will then be able to describe the imbalances, cyclical effects, adjustments and discrepancies that allow, in the given geopolitical context, the price of such a strategic raw material for the global economy to vary sharply in significant proportions.
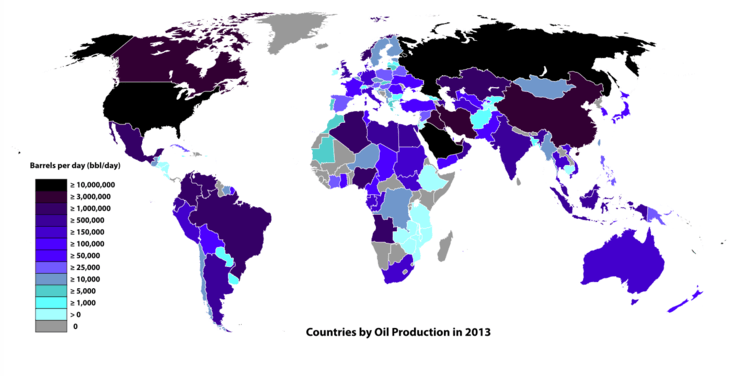
Figure 1: Countries by oil production in 2013
OPEC’s Role
Production of the Organization of Petroleum Exporting Countries (OPEC) is equal to the global demand, less the non-OPEC production: this apparent truism reflects the dominant mode of operation of the oil market. Because OPEC represents more than two thirds of conventional oil reserves, it is the “peak producer” of the market, one that adjusts its production to meet the combined changes in demand and evolutionary trends of other producers. These indeed produce at full capacity, which evolve over the medium-term based on the depletion of reserves and investments. But contrary to the theory of Hotelling, producers do not deploy a strategy to optimize their long-term gains. As noted by economist and oil specialist at MIT Morris Adelman, the logic of producers is usually that of Take the Money and Run. OPEC, since its creation and apart from its rare moments of geopolitical crisis, therefore ensures the arbitrage of the market and the compatibility between supply and demand. This permanent adjustment would stabilize the market and lead to regular price developments, continuously reflecting the relative dynamics of supply and demand. However, this is not the actual case and it appears that prices vary little over the course of five-to-ten years during which tension accumulates before suddenly adjusting to oil price shocks and counter shocks.
Fluctuation Cycles
The best way to describe this phenomenon as shown by oil specialist Dermot Gately is to observe oil price dynamics in function production levels of OPEC countries beginning in the 1980s. We can see a “phenomenological” approach to these changes, an approach which must be supported by economic analysis, taking into account historical and geopolitical elements. The cycles described in the “snail” diagram below clearly show the alternating periods of over and underestimation of oil prices.
Figure 2: OPEC production (M bbl/d)
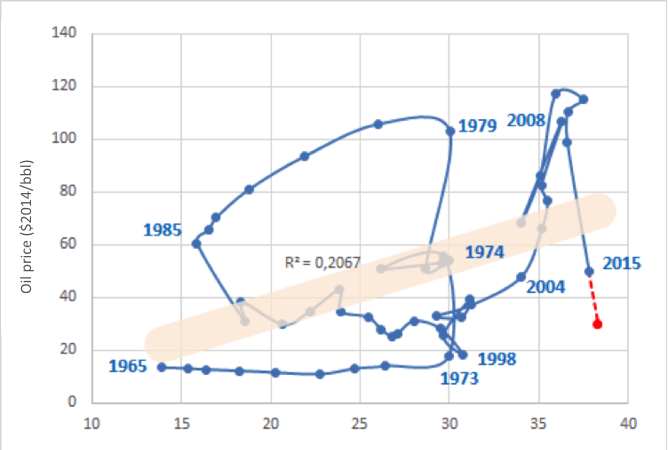
Source: OPEC Oil monthly oil report 2016
• 1965-1998: the beginning of OPEC and the oil shocks at the end of the first cycle
OPEC, created in 1960 at the instigation of Kuwait and Venezuela, fights in its early years not on price, but to reinforce the tax imposed on foreign companies. In 1965 it produced 13 million barrels per day (bdp) for a price of $15 ($2 at the time). Until 1973 the price was blocked by international companies and production growth was accelerated to meet global demand, reaching 30 bpd on the eve of the first oil shock eight years later. With the detonator of the Yom Kippur War this brings the price to $55 and stops increases in quantities. The second oil shock in 1979 is no longer triggered by OPEC, but by panic on the market following the Islamic revolution in Iran: the price settles above $100/bbl. Zaki Yamani, Saudi Arabian Minister of Petroleum, is aware of the risks and does not endorse this increase without resistance. In the following six years, OPEC – for the first and maybe the last time – acted as a real cartel and reduced its production to defend price levels. In a plunging decrease to its production level, Saudi Arabia produces no more than 3 bpd in 1985, just barely as much as the United Kingdom. Zaki Yamani triggers the first price war against Margaret Thatcher and her offshore fields in the North Sea. After this counter-shock and with new levels of around $30/bl, the recapture of the market begins, barely disrupted by the invasion of Kuwait by Iraq in 1990. In a full blown geopolitical crisis, Sadek Boussena, Algerian Oil Minister, then president of OPEC, said, “OPEC has no intention of triggering an oil shock.” The first cycle ends in 1998, the year in which even good observers believed that prices wouldn’t exceed more than $20, while the Economist titled it as, “Drowning in Oil!” The review of the snail diagram should have been more cautious by signaling market conditions dangerously close to those of 1973. End of a cycle.
• 1998-2008-2014: from the beginning of the “raw material super cycle” to the “economic megacrisis”
Michel Aglietta identifies the years 1997-1998 as a turning point for the global economy. It’s the end of the financial crises in the South and marks the beginning of a decade of accelerated growth. Just until the other financial crisis, that in the North in 2008, the world experienced unprecedented growth of more than 5% on annual average and the super cycle of raw materials begins. During this time, all routes, including ocean freight, disappear due to Chinese demand exacerbated by the 2008 Olympic Games in Beijing. Oil is no exception and the arrival of speculative market capital adds to this instability. They say it’s for a Guinness Record that a trader passes the first oil contract of more than $100 in the summer of 2007. The financial crisis has a significant impact on the oil market and the price falls again to $70 in 2009. But the effect is only temporary; if the economies in industrialized countries suffer, those of emerging countries remain dynamic: the demand is not at all weakened as after the second oil shock (1979). It rises again in 2010 and is once again on the linear trend of the last thirty years, bringing the price above $100 until 2014.
Figure 3: World oil production (1000 bbl/d)
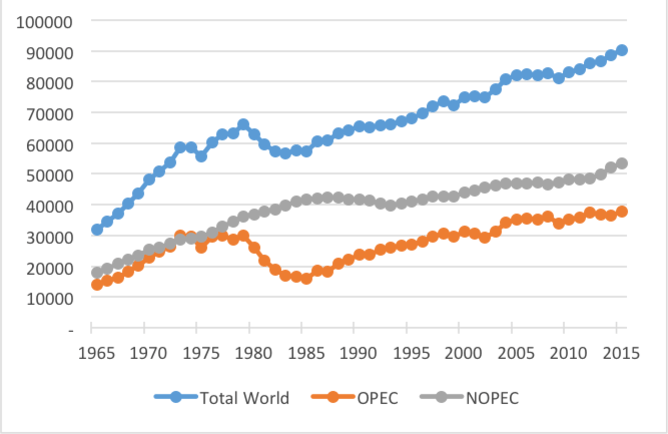
Source: OPEC Oil Monthly Oil Report 2016
• Ryiad against Washington: the second price war
So what happens? As with the shocks in the 1970s, when a barrel already reached $100, Saudi Arabia once again triggered a price war in which the goal was to curb shale oil development. Since the mid-2000s, the combination of technological progress in the US and very high price levels makes production of shale gas more affordable (obtained by hydraulic fracturing) than shale oil. US production, down to 6.8 bpd in 2006, remounts reaching 11.6 bpd in 2014. Who would have thought that five years before the United States would become the world’s top producer besting Saudi Arabia (11.5 bpd) and Russia (10.8 bpd)? Broadly speaking, a price above $100 pays for a set of unconventional resources or those difficult to access (in “deep offshore”). They now enter in competition with OPEC production at this time when, in the midst of it, Iraq increases its capacities and we expect a massive return of Iran after lifting economic sanctions aimed at Tehran for thirty years; at the same time, doubts are emerging on Chinese growth. In this context, Saudi Arabia chooses to drop the price and not resist the increase using cartel behaviour, in contrast to the 1980-1985 period. This is the second price war. As for the first, in 1986, one wonders if this war is primarily “exterior” or “civil” within OPEC. It still occurs in a particularly explosive geopolitical context in the Middle East, with the Syrian crisis and antagonisms between Iran and Saudi Arabia. Hence radical uncertainties trigger the rise in prices.
Chronic Instability
The rising price of oil, more than the long phase of low prices, stimulates demand and curbs alternative sources. The existence of different resource categories, conventional and unconventional, present on one hand very different production costs– between $20 and $80/bl – and on the other hand, a dominant actor which disposes of a significant quantity of reserves at a low cost, explains the structural instability of oil prices. However, this indicates that if global demand is not overly impacted by climate policies towards the middle of the century, oil will be definitively cheap and plentiful. In the long term, the establishment of carbon prices – by taxes or quotas – will have a double effect: the increase in consumer prices of fossil fuels to reduce demand; lower international prices resulting from the weakening of global demand. As explained by Pierre-Noel Giraud in his chapter, “Adieu Malthus” (The Useless Man), we did not, contrary to the peak oil thesis, have a problem with shortage of hydrocarbon resources; but we have a very serious “garbage problem” to store CO2 waste from combustion. This article was originally published in French by The Conversation France 