Request the publication (FREE)
Evaluating the European progress in energy consumption and efficiency
Here is an overview of the comprehensive insights available in this deep analysis of the evolution of the industry in energy consumption and efficiency in the EU. To get all the comprehensive data, you can request the full publication, providing you 11 graphs illustrating the trends.
Industrial Energy Price Trends
Industrial energy prices experienced extreme volatility between 2019 and 2024, characterised by a massive 70% peak in 2022 following year-over-year hikes of 16% (2021) and 54% (2022). While prices declined by 10% annually through 2024, they remained 33% higher than 2019 levels. In the EU, countries’ experiences varied widely, with 2022 price increases ranging from 23% to 85% compared to 2019.
Figure 2: Variation in average energy price in industry at EU level*
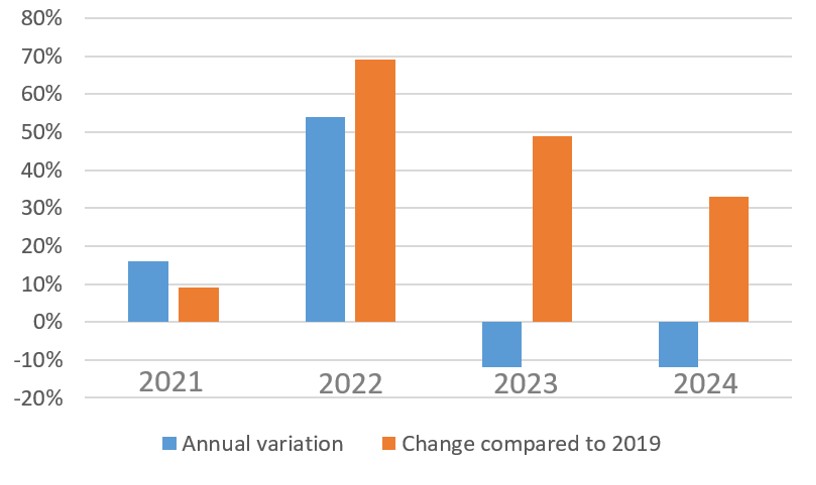
*Weighted average price at constant prices
Energy efficiency trends and energy savings in the industry
The ODEX index1, which tracks energy efficiency across 15 industrial branches while removing structural biases, reveals that EU industrial energy efficiency has improved by 19% since 2010 (averaging 1.5% per year).
The rate of progress has fluctuated significantly over the last decade:
- 2010–2019: Steady improvement of 1.2% per year.
- 2019–2023: A notable acceleration to 2.4% per year.
- 2024 (Estimate): A return to the long-term trend of approximately 1.2%.
Figure 4: Energy Efficiency Index Industry - EU
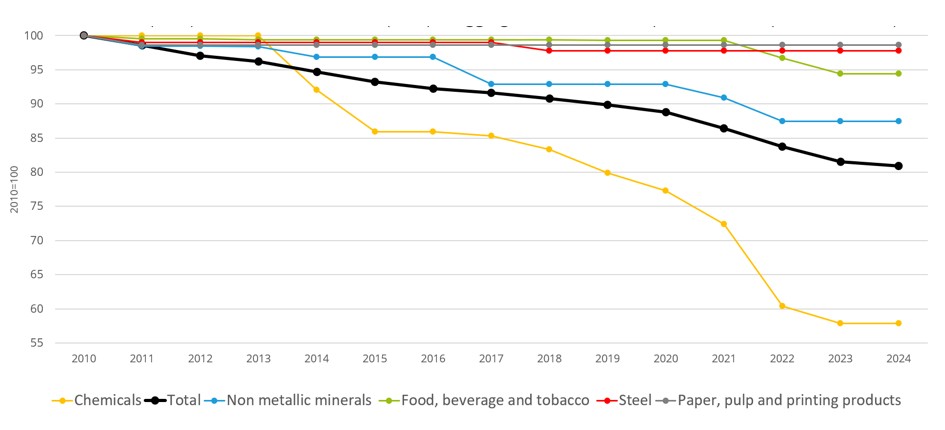
Source: Odyssee – Mure project
Drivers of industrial energy consumption
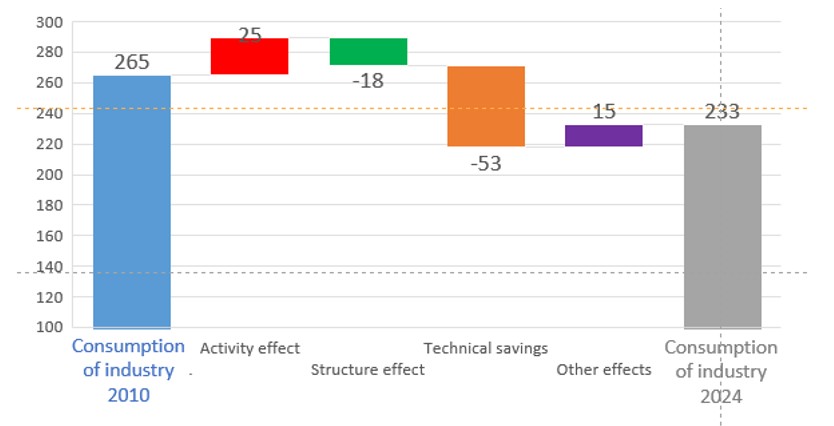
By 2024, EU industrial energy consumption had decreased by 32 Mtoe compared to 2010 levels. This reduction was primarily achieved through 53 Mtoe in energy savings and an 18 Mtoe reduction attributed to structural shifts towards less energy-intensive industries. Together, these factors successfully offset a 25 Mtoe increase in consumption driven by overall growth in industrial activity.
Figure 7: Decomposition of industry consumption variation in the EU (2010-2024, Mtoe)
Note: