New Consolidated Statistics & Estimates integrating COVID 19 impact

2020 has been nothing like we expected. The constant evolution of the Covid19 pandemic has drastically impacted the global energy demand, as lockdowns all over the world have led to reduced economic activity. At Enerdata, we have been monitoring the global energy markets continuously, and are keen to share our findings leveraging our latest statistics and newest short-term estimates with you.
This quarterly update of the Global Energy Trends publication features statistics for all energies and emissions, consolidated electricity data up to the end of September 2020, and robust estimates for the rest of the year, with focused analyses for some key G20 countries: China, US and EU 28. It notably looks at the energy demand rebound after lockdowns, the evolution of G20 countries' power mix, or whether emissions reduction goes beyond energy demand reduction. We also highlight the transport sector, which was impacted like no other.
2020 New Estimates: World
- Energy consumption is falling 30% faster than the GDP
- CO2 emissions are decreasing 50% faster than energy consumption, due to the higher impact of the economic crisis on sectors with a relatively high carbon factor (thermal power generation, transport)
* Includes international air and sea transport (not included in country data).
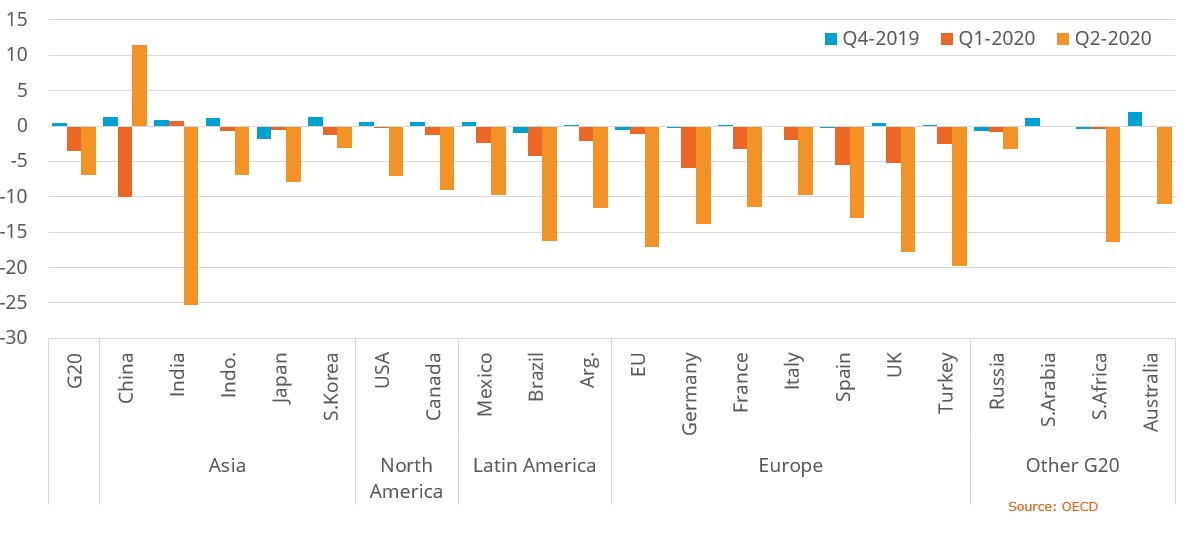
As expected, the world economy crashed in Q2 2020
Quarterly GDP growth (%, Q4-2019, Q1-2020 and Q2-2020)
Other Notable 2020 Key Findings detailed in the Global Energy Trends Publication:
- The differences between the declines in GDP, energy consumption and emissions are significant and explainable.
- The drop in CO2 emissions in 2020 is historical but should be taken with caution: it is mostly a direct result of the economic recession and lockdown policies during the sanitary crisis.
- The increasing weight of renewables in the power mix also has a noticeable impact but will probably be temporary (low power demand). At best we will return to the previous trajectory or at worst experience a slowdown, depending on whether players slow down their investments in this area.
- A rebound effect of the CO2 emissions in 2021 is likely, depending on the economic recovery and people mobility.
Enerdata’s analysis with 2019 actual statistics and 2020 estimates
May 19, 2020
Enerdata’s analysis with 2019 actual statistics and 2020 estimates
The year 2019 was marked by a global economic slowdown (-0.6 points) that translated into a much lower energy consumption growth (0.6% compared to 2.2% in 2018).
This publication analyses global and regional figures, drilling down to some key countries. In addition, short- to mid-term scenarios are elaborated to assess the implications of the COVID 19 situation on the global energy markets.
G20* Key Energy Figures in 2019
* G20 countries account for 80% of global energy consumption
The change was particularly drastic for coal, whose consumption registered a sharp decline (-3,6%, compared to +0,6% in 2018), while oil consumption accelerated (+1,2%), and gas consumption continued on its upward trend (+3,2%), spurred by surging gas production in the United States.
Electricity consumption growth, following the more sluggish economic conditions, slowed down (+0,7% total) in most G20 countries, and declined in some.
Other Notable 2019 Trends in the G20, as Detailed in the Global Energy Trends Publication:
- Spectacular increase of natural gas consumption (+3.2%), with the USA responsible for more than 30% of the global increase.
- Still no peak in oil and gas consumption (which grew at +1,2% and +3,2%, respectively)
- Significant slowdown in electricity consumption growth in 2019 in G20 (+0.7% vs +3,6% in 2018). China, which accounts for 1/3 of the G20 electricity consumption, posted a 4.5% growth, but this was much lower than the average growth observed since 2007 (7.5%/year).
- Strong development of renewables continues: +11% in wind power generation and +22% in solar power generation, slower than in 2018 but still higher than any other power sources.