Enerdata published its annual analysis of world energy demand, based on its 2012 data for G20 countries. This report confirms several ongoing trends initiated in previous years, and notes an acceleration for some of them. Beyond these trends, noticeable shifts are the significant variations within the power mix, particularly between gas and coal, and the growing weight of the BRICS1.
The BRICS are driving the growth of the world energy demand
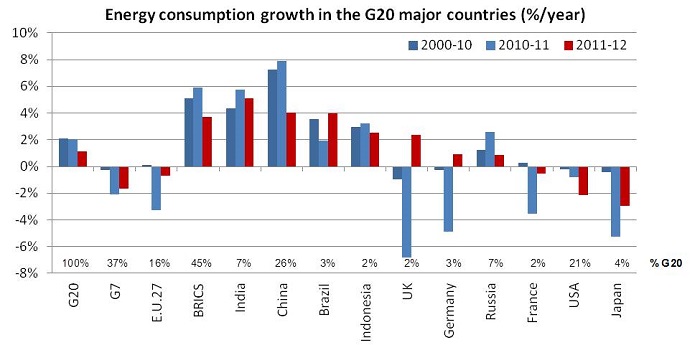
The world energy consumption grew by 1% in 2012, 1 percentage point less than the economic growth and half the trend from the last decade. In this context of low growth, the BRICS increased their energy demand by 3.7%. China experienced a strong slowdown in its energy consumption growth (+4% in 2012 vs. +8% in 2011) partly as a result of the slow progression of its coal consumption (+2.5% in 2012 vs +10% in 2011). India recorded the highest energy consumption increase in 2012 amongst BRICS countries with +5.1% (+5.7% in 2011) followed by Brazil (4%) and South Africa (3.9%). The Russian energy demand only increased by 0.9% mainly due to a gas consumption drop. Conversely, for the fourth year since 2008, the G72 countries’ energy demand shrunk; by 1.6% in 2012. Except for Germany and the UK, the five others countries reduced their energy consumption, with Italy recording the highest drop (-4.2%). Weather conditions have a strong impact on energy consumption. The 2012 mild winter in North America enhanced the energy demand reduction in the USA, since under a normal climate the consumption would have been 1% higher3 . On the contrary, the cold 2012 winter in the European Union increased energy consumption, which would have been 1% lower during normal weather conditions.
Source: Enerdata - Global Energy and CO2 Data
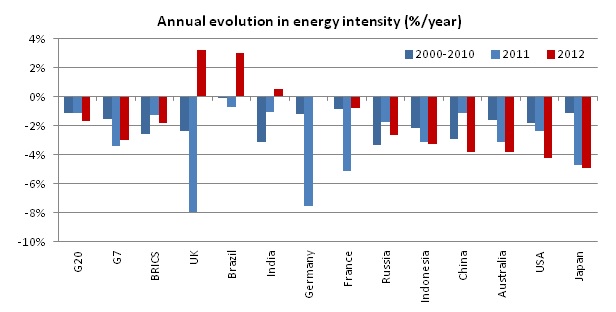
The shrinking of energy consumption in G7 countries coupled with an economic growth of +1.4% has resulted in a significant drop of the G7 countries’ energy intensity (-3%) in 2012. The best performance was achieved by Japan that reduced its domestic energy consumption by -2.9% while increasing its GDP by +2% leading to a drop of its energy intensity by -4.9% in 2012. Likewise, the USA and Australia improved their energy efficiency by about 4% thanks to the combination of energy consumption reduction and GDP growth. The BRICS energy intensity reduction of 1.8% observed in 2012 was mainly produced by China and Russia while India and Brazil recorded a rise in their energy intensity primarily driven by industry.
Source: Enerdata - Global Energy and CO2 Data
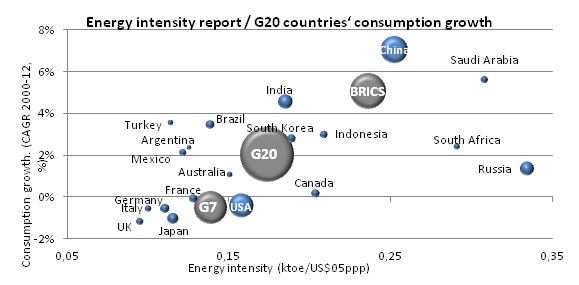
The evolution since 2000 of world energy consumption has been driven by China and India with a growth of their energy consumption by around 5% on average and an energy intensity 70% higher than the G7’s. Large energy producers such as Russia, Saudi Arabia and South Africa have high energy intensities as their economies rely on energy-intensive industries made possible by cheap energy prices.
Source: Enerdata - Global Energy and CO2 Data
The year 2012 saw significant changes in energy consumption trends as coal consumption growth slowed down significantly (1.3%) compared to 2011 (5.1%) while gas demand growth continued to increase by more than 2%.
Gas and coal progress in opposite directions in the United States and in Europe
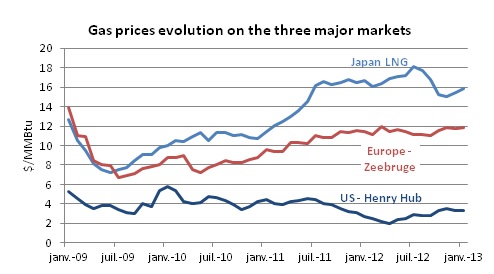
Among G7 countries, strong countervailing effects were observed between gas and coal in the USA and in Europe. The massive development of unconventional gas production in the USA has made domestic Henry Hub gas prices drop by 30% in 2012, from US$4/MMBtu on average in 2011 to US$2.75/MMBtu in 2012 (yearly averages). As a result, American power utilities realised a coal-to-gas switch to give priority to gas as the cheapest energy source.
Source: Enerdata - Energy Prices Monitor
Consequently, overabundant US coal was exported at very competitive prices resulting in a coal price drop of 24% in Europe in 2012, from US$143/Mt in 2011 to in US$109/Mt in 2012. This produced a large substitution of gas to coal in power generation; the opposite move as observed in the USA. As a result, coal exports from the USA to Europe increased twofold in 2012 compared to 2011.
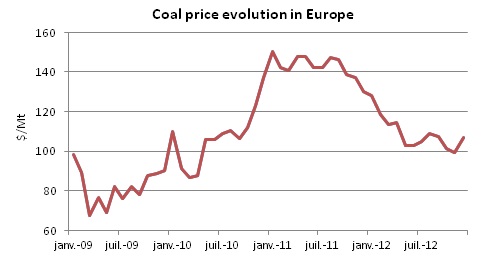
Source: Enerdata - Energy Prices Monitor
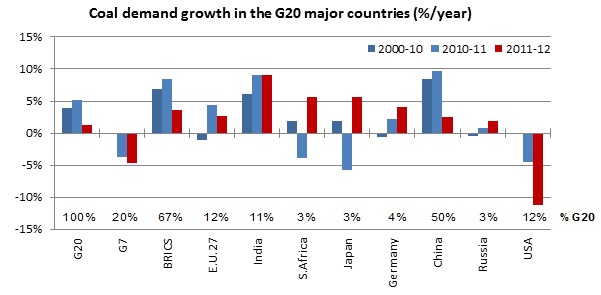
This change in the power mix was particularly marked in the UK (where coal increased from 30% to 40% in the electricity mix between 2011 and 2012), in the Netherlands (from 22% to 28%), in Spain (from 14% to 17%) and in Italy (from 17% to 19%). It is also true in Germany, where coal was already the major fuel. This massive increase in the use of coal, that is less efficient than natural gas for producing electricity, led to a drop in the average efficiency of thermal power plants in all these countries, with the highest reduction observed in the UK (from 44% in 2011 to 41% in 2012). These countries also experienced a subsequent increase in CO2 emissions from power generation (+ 10% of CO2 emissions per kWh produced in the UK between 2011 and 2012 for example). Coal consumption has globally slowed down, achieving a growth of 1.3% in 2012 compared to 5.9% in 2011. The worldwide deceleration in coal consumption is mainly due to changes in Chinese demand (2.5% in 2012 compared to 9.7% in 2011). China represents 50% of the total G20 coal consumption (3 470 Mt out of 6 960 Mt). The second largest coal consumer, the USA, has reduced its use by a dramatic 11% (804 Mt consumed in 2012) while India, the third largest coal consumer, recorded a 9% increase well above the past decade average. In 2012, China, the USA and India together accounted for 72% of G20 coal consumption.
Source: Enerdata - Global Energy and CO2 Data
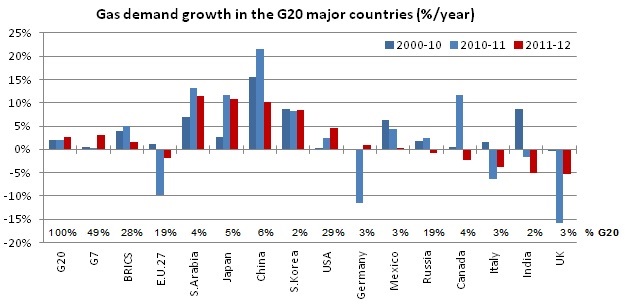
For the eleventh year in a row, with the exception of 2009, gas consumption increased in 2012. It rose at a pace of 2.6%/year, higher than the historical average of 2.1%. This trend was mainly driven by the U.S. demand, which represents a third of G20 consumption, with a +4.6% increase boosted by the use of shale gas. In Japan, gas consumption surged by 10.8%/year, close to the 11.6% recorded in 2011 following the Fukushima accident. In China, natural gas consumption grew half as fast as in 2011 and at a slower pace compared to the 2000’s decade (15.6% rise on average). South Korean gas consumption continued to progress by more than 8% in 2012, in line with its progression observed since 2000. Conversely, Russian gas consumption (20% of the G20 gas consumption) shrunk by 0.9% partly due the commissioning of efficient gas-fired plants (more than 6 GW of CCGT capacity were commissioned in 2011 and 2012, i.e. about 90% of the new gas-fired plant capacities). European gas consumption dropped by 1.9% with severe reductions in UK and Italy as a result of the substitution to coal in power generation. The cold winter in Europe partially offset the decrease in the gas consumption; this drop would have been even higher under normal climate conditions.
Source: Enerdata - Global Energy and CO2 Data
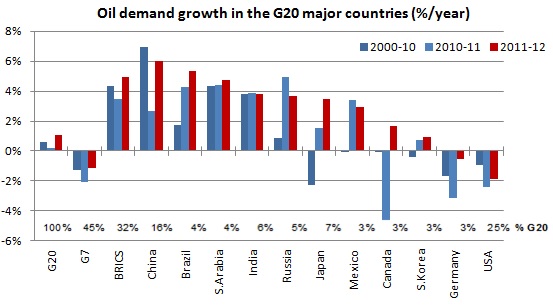
Oil demand increased by 1% driven by the largest energy consumers in Asia, with dynamic growth in China (+6%), India (3.8%) and Japan (3.5%); Latin American countries recorded significant increases, with Brazil (5.3%), Argentina (3.8%) and Mexico (3%); while Russian growth achieved 3.7%. With the development of shale gas, the USA kept their oil consumption trend heading downward with a decrease of 1.9%, following the 2.4% drop in 2011, leading the country to its lowest annual demand growth since 1992. European countries recorded the same reduction as in 2011 (-3.4reflecting the weak European economy, high oil prices (US$112/bbl for the Brent on average in 2012), the continuing switch to natural gas in thermal uses as well as the growing penetration of efficient vehicles.
Source: Enerdata - Global Energy and CO2 Data
After China overtook the US in power consumption in 2011, the BRICS caught up to the G7’s level in 2012 with around 6 800 TWh. The two entities have had opposite trends in power demand in 2012. Despite a lower power consumption growth in 2012, BRICS countries recorded an increase of 4.6% (more than 8% per year on average since 2000). G7 countries’ power consumption shrunk by 1.1% following the drop by 1.6% in 2011, with a reduction by 1.7% in the USA and 0.6% in Europe.
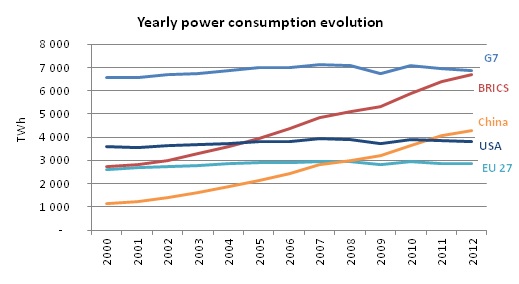
Source: Enerdata - Global Energy and CO2 Data
Despite the global cost reduction of renewable energy sources, 2012 has shown a slowdown in the progression of new installations compared to the trend observed over the last five years. The European Union recorded the largest slowdown due to changes in support schemes and reductions in feed-in tariffs. With a freeze of its feed-in tariffs in 2012, Spain has significantly reduced its growth, as well as Italy where a tremendous amount of new capacity was installed in 2011. Germany continued to break records with 7.6 GW of additional PV capacity installed in 2012 and 2.4 GW of wind energy systems. The wind sector was boosted by China and the USA which each installed more than 13 GW of new capacities in 2012. Both countries also installed more than 3.5 GW of PV capacities.
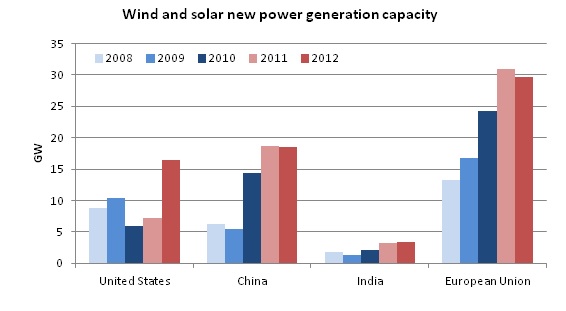
Source: Enerdata - Global Energy and CO2 Data
Weight of the BRICS couple with coal substitutions in Europe led to more CO2 emissions
The trends noted in this overview resulted in an overall increase of CO₂ emissions (+1.4%), but also higher than the increase of energy demand (+1%). This is mainly due to the prevailing use of coal in the energy mix by the BRICS, accentuated by their growing influence in world energy demand. Moreover, the increased use of coal in the EU cancelled the growing share of renewable energies in its power mix. These two phenomena offset the CO2 emissions reduction registered in the United States from the accelerated coal-to-gas switch. The almost total shutdown of nuclear power in Japan and its substitution by fossil energy sources also contributed to increased emissions (+5.7% despite a decline in energy consumption by 3%).
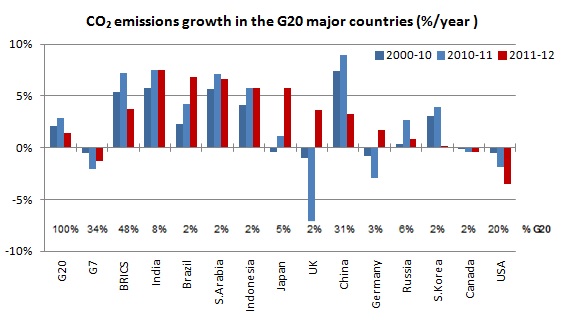
Source: Enerdata - Global Energy and CO2 Data
Notes:
1 The BRICS = Brazil, Russia, India, China, South Africa
2 G7 : Canada, France, Germany, Italy, Japan, United Kingdom, United States
3 Consumption levels determined if climate effects are accounted for