Which factors? What are their impacts on a 30-year period?
Get this executive brief in pdf format
The European Union has set ambitious decarbonisation targets for 2030 and 2050. Considering that transportation is the only sector to have increased its CO2 emissions since 1990, it is crucial to understand what explains their evolution, in order to better identify which levers can be operated to accelerate decarbonisation.
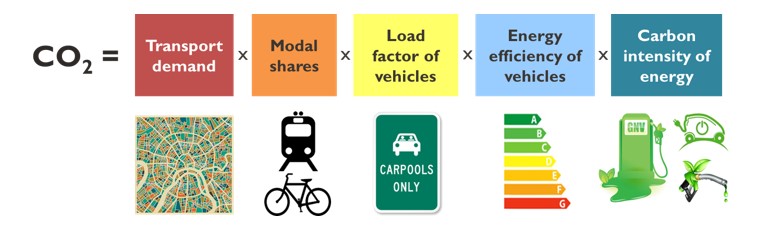
This article asses the relative contribution of five factors to the historical evolution of transport CO2 emissions: transport demand, modal shares (i.e., the relative importance of the different modes of transport), vehicle load factor, energy efficiency of modes, and energy decarbonisation (i.e., the decrease of its carbon intensity).
Methodology
The decomposition analysis is applied to the EU1over the period 1995-2019 and covers passenger and freight transport. The trends of five European countries are also studied, namely France, Germany, Italy (when data quality is satisfactory), Spain and the UK2. Their trends will be discussed in the main body of the article while figures for each country are provided in the appendix.
For the decomposition analysis of passenger transport, four modes of transport are considered: individual road transport (including private cars and motorcycles), collective road transport (buses and coaches), rail transport, and domestic air transport. For freight transport, three modes are considered: road transport (heavy goods and light commercial vehicles), rail freight, and water transport3.
The decomposition methodology used is the log-mean divisia index, with the following decomposition equation (more information on the method in Ang, 2004; Bigo, 2020):
Where Di represents the demand for passenger or freight transport of mode i (passengers.km or tons.km4) and D the total demand ; Ci the vehicle traffic of road transport mode i (in vehicles.km) when data are available; Ei the energy consumption by mode i (in tons of oil equivalent); CO2,i : CO2 emissions of mode i (in MtCO2).
Results of the decomposition over the global period
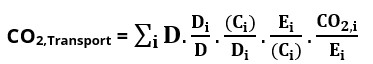
Between 1995 and 2019, passenger transport emissions increased by 12%, with a period of decline between 2007 and 2013 that will be discussed in detail in this article.
- Transport demand contributed to increase emissions by 31% over the period, making it the main factor responsible for the increase in emissions. There is a relative decoupling of the demand and emissions curves, especially during the 2007-2013 period, although the two curves generally follow similar trends.
- At the same time, the contribution of modal shift is low, with a slight upward trend in emissions (+2%) over the entire period. Modal shift occurs from public road transport to cars and airplanes5.
- Energy efficiency improvements contributed to a 12% reduction in emissions. Details for some countries on the decomposition between vehicle occupancy rate and engine energy efficiency show that engine efficiency improvements actually made a larger contribution, but were partially offset by the decline in average car occupancy rate over the period, despite most governments’ desire to facilitate carpooling.
- Finally, the decarbonisation of energy has made little progress since 1995, apart from the development of biofuels. Thus, the contribution of energy decarbonisation to the overall reduction of CO2 emissions remains moderate at the EU level (-5%).
Figure 2: Decomposition of the evolution of CO2 emissions from EU passenger transport, from 1995 to 20196
Source: the calculations were made by the authors using data from the ODYSSEE database7
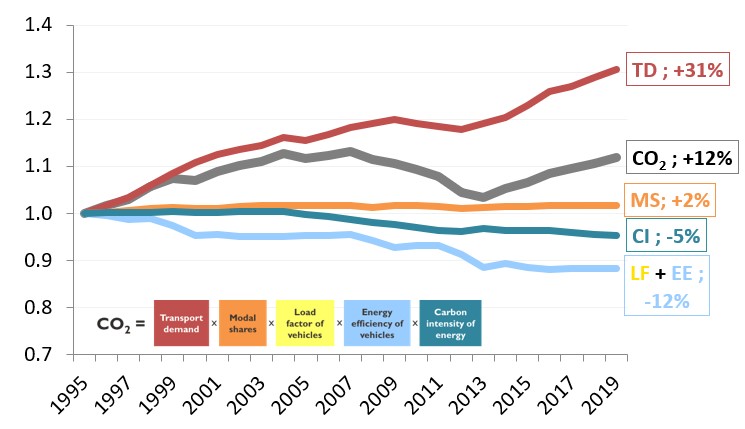
Emissions from freight grew twice as fast as those from passenger transport (+25%) over the period, although they temporarily declined following the economic crisis of 2007-2008:
- Transport demand also had a major impact on the evolution of emissions, with an increase of +45% over the whole period at the EU level.
- Modal shift had a more adverse impact in freight transport than in passenger transport, with a loss of shares for the most virtuous modes: -6 points for rail (from about 24% to 18%) and -1.6 for waterways (to 6% in 2019) to the benefit of road transport. However, transport efficiency has improved for these different modes, accounting for an overall contribution of -17% over the period. These gains can be explained at least in part by improved load factors (tons transported per vehicle).
- Finally, as for passenger transport, the contribution of energy decarbonisation to the evolution of CO2 emissions has been weak (-4%).
Figure 3: Decomposition of the evolution of CO2 emissions from EU freight transport, from 1995 to 20198
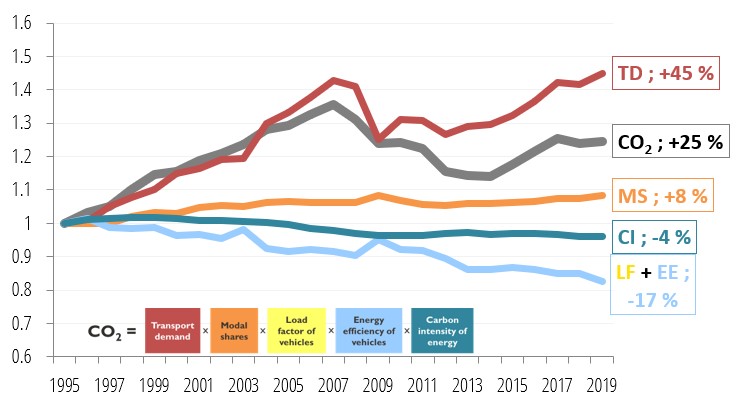
Source: the calculations were made by the authors using data from the ODYSSEE database9
An evolution in 3 successive periods
The analysis of the evolution of emissions shows 3 distinct periods, for both passengers and freight, as shown for the EU as a whole in the figures above:
- From 1995 to 2007, a period of strong growth in demand which drove up emissions;
- Between 2007 and 2012, a period of falling demand due to the economic crisis, with the development of biofuels also contributing slightly to the fall in emissions;
- Finally, between 2012 and 2019, demand and emissions are on the rise again, in the EU as a whole and in most countries.
It should be noted that in most countries, the modal shift factor also evolved more unfavourably during periods of higher demand growth, which were mainly driven by road transport.
The trends in these three periods are obviously related to economic cycles and particularly to the crisis of 2009, which was accompanied by a weaker evolution of transport demand lasting up to 2012. These trends are also consistent with higher oil prices over the period, an exogenous element to transport policies that has affected all European countries.
A growing demand for transportation
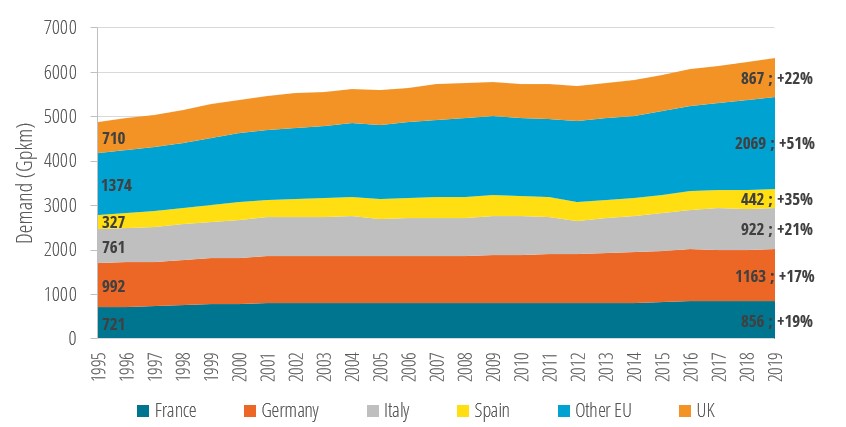
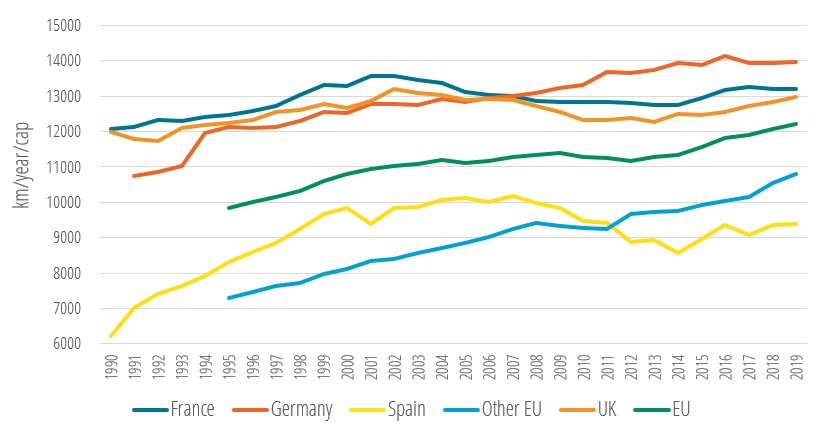
Transport demand increased by 31% over the whole period in the EU. This growth is found in all the studied countries, with about +20% in France, Germany, Italy, and the United Kingdom, +35% in Spain, and an even higher growth in the rest of the EU countries (+51%). Data on kilometres travelled per person per year show that the latter category has caught up with the countries specifically analysed in this study, approaching a European average of about 12 000 km per year.
Growth was stronger until the early 2000s and then after 2012, while the period in between was characterised by weaker growth or even a decline in demand, in a context of economic crisis and high oil prices from 2007-2008 onwards.
Figure 4: Evolution of passenger transport demand in the EU and the UK
Source: Enerdata, ODYSSEE database
Figure 5: Evolution of kilometres travelled per person per year, by country10
Source: Enerdata, ODYSSEE database
The demand for freight transport is measured in ton-kilometres. It has also increased over the period 1995-2019, by 45% in the EU. This growth stalled sharply with the crisis of 2008 (-13% in 2 years), and the resumption of growth has since brought total demand back to about its 2007 level. In comparison with passengers, the growth rates of freight transport demand vary a lot between countries (from -5% for Italy to +65% for the other EU countries).
Figure 6: Evolution of freight transport demand in the EU and the UK
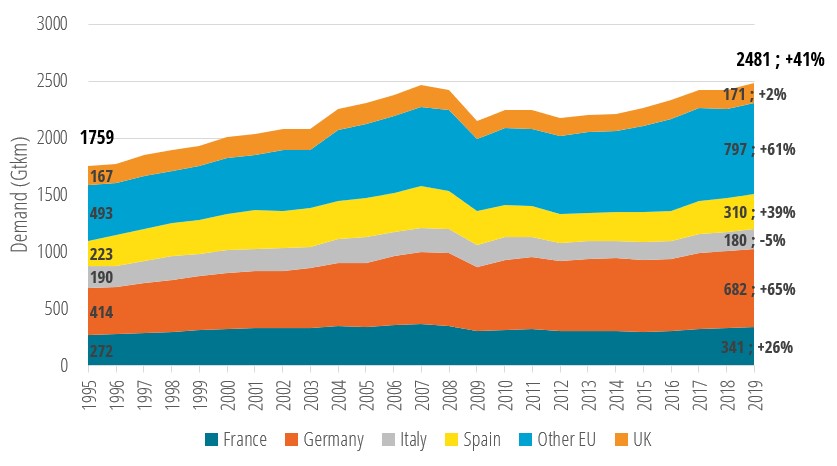
Source: Enerdata, ODYSSEE database
An increase in the share of the most energy-intensive modes for passengers, and even more so for freight
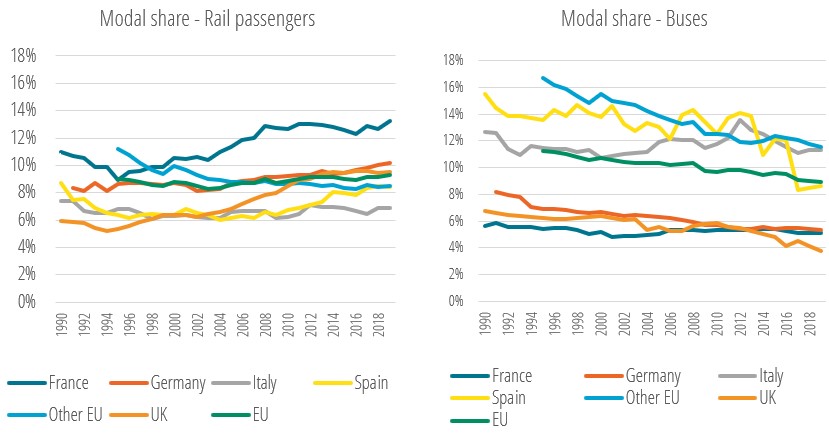
Overall, the modal shift for passengers appears to be low. The relative shares of the various modes in kilometres travelled have remained fairly stable, reaching about 80% for individual road transport (cars and motorised two-wheelers; +1.4% modal share between 1995 and 2019), 9% for rail transport (+0.3%) and public road transport (-2.3%), while domestic air transport has reached almost 2% (increase from 1.1% to 1.6% modal share, excluding international).
These low modal shifts can be explained by an overall growth in all modes of transport: +33% for individual road transport, +35% for rail transport, +4% for buses and coaches, and +93% for air transport. Although the intensity of the growth varies depending on the mode, this does not significantly change the overall modal split and in particular the predominance of the car in European mobility. For public transport, rail has tended to grow while buses and coaches have lost market share (see figure 7).
Depending on the country, the modal shares remain relatively stable. The strongest changes observed are the marked growth of individual road transport for the other EU countries (+8% modal share to 79%, at the expense of rail -3% and buses -5%), the decline of public road transport in Spain (-7%, at the expense of individual road transport +5% and domestic air transport +2%), and the growth of rail in the United Kingdom (+4%, at the expense of individual and collective road transport, -3% and -1% respectively).
Figure 7: Evolution of the modal shares of rail and collective road transport for passengers
Source: Enerdata, ODYSSEE database
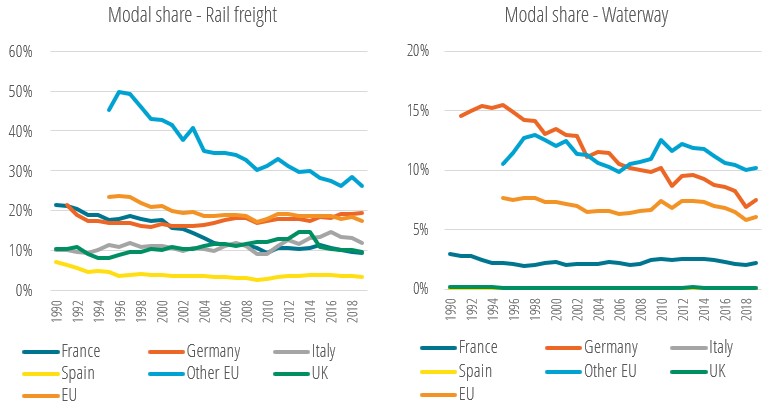
For freight transport, the modal shares of rail appear more contrasted across countries: while some have a particularly high or low rail share (Other EU countries and Spain respectively), most countries maintain this share between 10 and 20%. Similarly, water transport represents 6% of freight transport in the EU, with variations from near non-existence in Italy and Spain to reaching 10% in Other EU countries (including 42% in the Netherlands and 32% in Bulgaria).
Overall, it is essentially road transport that has gained modal shares (+6%, from 71% to 77%), at the expense mainly of rail transport (-5%, from 22% to 17%) and water transport to a lesser extent (-1.3%, from about 7% to 6%). This modal shift has contributed to the increase in CO2 emissions of freight transport, Italy being the only exception in this respect among the studied countries.
Figure 8: Evolution of the modal shares of rail and water freight transport
Source: Enerdata, ODYSSEE database
Contrasted progress in energy efficiency by period and by mode
For passenger transport, the main contributor to energy efficiency progress is the car. Progress is measured by the unit consumption of the car fleet per passenger-kilometre and includes several factors:
- The energy efficiency gains that can be measured in terms of specific consumption in l/100km correspond to improvements in engine efficiency and to the growing share of diesel (diesel being more efficient than gasoline). They also reflect the change in the average size of vehicles (e.g., the share of SUVs).
- The fuel mix effect linked to an increase in the share of diesel in fuel consumption, since diesel has a higher calorific value than gasoline, and to the penetration of biofuels.
- The occupancy rate of cars.
Depending on the evolution of these factors, three periods can be distinguished11:
- Between 2000 and 2007, the relatively large energy efficiency gains of 0.9%/year on average were offset by:
- the effect of the occupancy rate decreasing from 1.7 to 1.6 persons per car;
- the fuel mix effect.
- From 2007 onwards, the occupancy rate has tended to improve.
- Fuel efficiency progress were divided by 2 between the periods 2007-2014 and 2014-2019, which can be explained by the penetration of SUVs in car sales.
- Over the 2014-2019 period, the progress made is partially offset by the fuel mix effect corresponding to the penetration of biofuels.
Figure 9: Decomposition of the variation in unit car consumption per passenger-kilometre into different explanatory factors for the EU
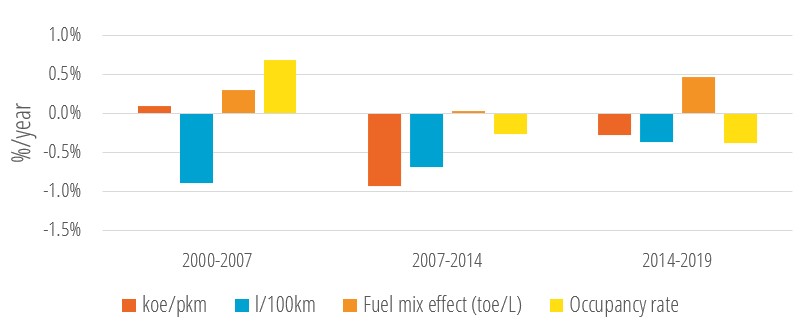
Source: Enerdata, ODYSSEE database
Energy efficiency gains are fairly homogeneous among the studied countries. This is due to the globalised vehicle market and European standards on emissions from new cars. These were introduced in 2009 with targets for 2015 and 2021 (130 and 95 gCO2/km respectively). They were further tightened in 2020 with new targets for 2025 and 2030 (-15% and -37.5% respectively compared to 2021) in line with the new European ambitions of the Green Deal.
For freight transport, the evolution of energy efficiency is more sensitive to economic cycles. For road transport, the main contributor to energy efficiency improvements in freight transport, progress is relatively homogeneous over the period, except in the recession period between 2008 and 2011. During this period, we observe a deterioration in energy efficiency due to less efficient truck operations (lower loading rates and empty trips).
A small contribution from energy decarbonisation
The carbon intensity of energy is measured in tCO2/toe. In this study, the change in the carbon intensity of energy includes two aspects: the shift from a carbon-intensive energy to a less carbon-intensive energy, and the change in the carbon content of each energy. The contribution of energy decarbonisation to emission reduction is small between 1990 and 2019, as shown in Figures 2 and 3 (-5% for passengers and -4% for freight). This is because oil consumption still dominates all the other energies (about 95% of overall energy consumption in 2019). It might also be related to ambiguous results of both European and national measures.
Nevertheless, the EU – and especially France, Germany, and Spain – experienced a slight acceleration in the decline of energy carbon intensity in the mid-2000s.
This progress is mainly due to the penetration of biofuels resulting from the implementation of European targets for renewable energy consumption (Renewable Energy Directives, RED I and II).
Thus, since 2003, the European Union has set non-binding consumption targets for 2010 (2% in 2005 and 5.75% in 2010) and conditioned the exemption and reduction of taxes in member countries. From 2006, a higher incorporation of biofuels in diesel and gasoline was allowed and led to a rapid increase in consumption in the countries studied.
However, the convention that considers the combustion of biofuels to be carbon neutral has been challenged on several occasions since the early 2000s. Indeed, studies combining life cycle analysis and land use change (EEA, 2013; Bigo, 2020) seem to conclude that the carbon impact of biofuels has been largely underestimated.
The European Union has thus revised its position in 2018 (RED II) by including sustainability criteria in biofuel production in order to better consider, on the one hand, competition with agricultural production, and on the other hand, the environmental impact of land use change. The new directive set a target of 14% of renewable energy in consumption, with 3.5% of second-generation biofuels and a limit of 7% for first-generation biofuels.
Figure 10: Share of biofuels and decarbonised electricity12 in final transport consumption
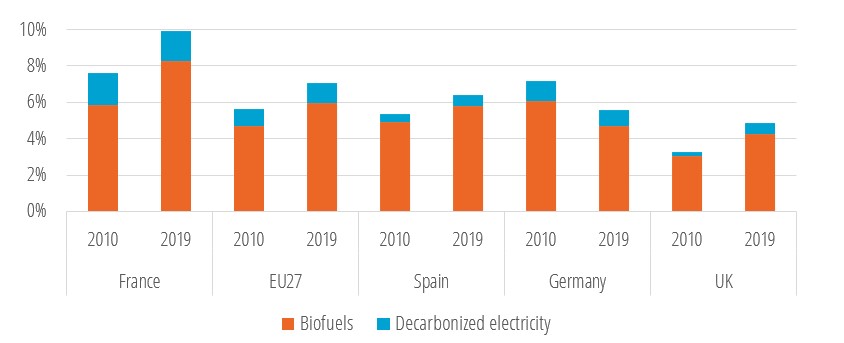
Source: Enerdata, ODYSSEE database
In addition to measures on biofuels, EU countries have focused on the electrification of the vehicle fleet. Most European countries have introduced purchase subsidies for electric vehicles and plug-in hybrids, which led to an increase in sales from 2010 onwards, followed by an acceleration in 2015 that has intensified since 2019 (Figure 11). However, the best performing countries on this criterion have also invested heavily in the installation of public charging stations and apply high tax rates on fossil fuels (Norway, Netherlands, Sweden).
It should be noted that the penetration of electric vehicles affects both energy efficiency and carbon intensity. Indeed, electric vehicles are more efficient than thermal vehicles, thus improving energy efficiency. On the other hand, the impact on the carbon intensity of energy depends on the carbon content of the electricity used to charge vehicles. In contrast to biofuels, the evolution of the share of decarbonized electricity in the sector's consumption is very low over the period 2010-2019 (+0.17 points on average in the EU, -0.22 points in Germany).
Figure 11: Market share of electric and plug-in hybrid cars in new registrations and current car fleet
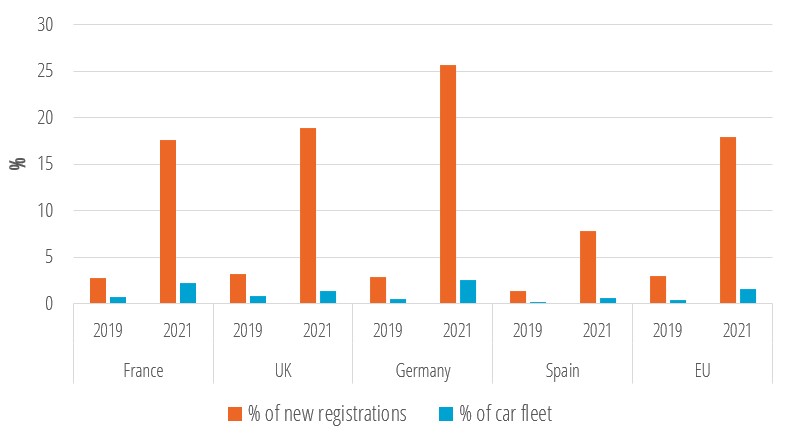
Source: Enerdata, ODYSSEE database
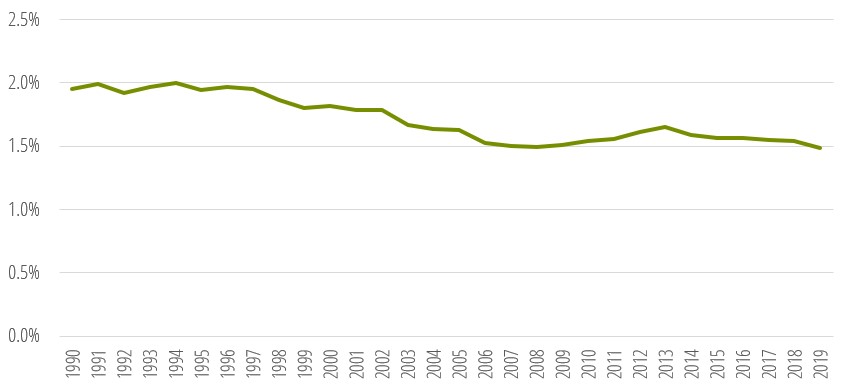
Electricity consumption in transport has decreased slightly at the European Union level (Figure 12: -0.4 points between 1990 and 2019).
Figure 12: Share of electricity in final transport consumption (EU)
Source: Enerdata, ODYSSEE database
Even today, this consumption is dominated by rail. Indeed:
- Despite the growing share of electric vehicles in new registrations, their share in the total fleet remains marginal (Figure 11);
- Household electricity consumption due to home charging is not counted in the transportation sector;
- As electric vehicles are more efficient than thermal vehicles, the number of kilometres driven in electric vehicles translates into a lower share of energy consumption.
Although the consumption of electric vehicles is not yet well accounted for, a quick estimate can be made from unit consumptions. Thus, the weight of electric vehicles in the electricity consumption of transport is about 2% for the EU in 2019. Therefore, the acceleration of the penetration of electric and plug-in hybrid vehicles has not yet had a significant effect on reducing the sector's carbon intensity.
Conclusion: what lessons and perspectives for the Green Deal?
Transport emissions trends prior to the 2019 Covid crisis are unfavourable, with emissions increasing for both passenger and freight transport. The main explanation lies in rising transport demand, the moderation of which should be part of the EU's goals to ensure that emissions fall in the short term and that 2030 targets are met. The increase in demand is particularly problematic in that it primarily concerns the most emitting modes (cars, trucks, air), which also implies stable or unfavourable trends in the modal shift factor. At the same time, progress in energy efficiency and energy decarbonisation is currently insufficient to offset this increase in transport demand.
Achieving climate objectives by 2030 therefore requires a break with past emissions trends, requiring enhanced and ambitious action on all five decarbonisation levers.
Note: this work was carried out by Ariane Bousquet (Energy and Prosperity Chair, Renault), Aurélien Bigo (Energy and Prosperity Chair), Bruno Lapillonne (Enerdata) and Laura Sudries (Enerdata).
Notes:
- EU does not include the United Kingdom.
- For these countries, the analysis sometimes covers the period 1990-2019, except for Germany which decomposition starts in 1994.
- International transport is not taken into account in the breakdowns because its consumption and emissions are not included in the transport sector.
- 1 pas.km = 1 km done by 1 passenger; 1 ton.km = 1 ton transported over 1 km
- Note that only domestic air travel is taken into account (the growth of international flights being even greater).
- TD: transport demand; MS: modal shares; LF: load factor; EE: energy efficiency; CI: carbon intensity
- Some data have been completed or reprocessed with other data from Eurostat's European Alternative Fuel Observatory (EAFO) or from DGMOVE.
- TD: transport demand; MS: modal shares; LF: load factor; EE: energy efficiency; CI: carbon intensity
- Some data have been completed or reprocessed with other data from Eurostat's European Alternative Fuel Observatory (EAFO) or from DGMOVE.
- Excluding Italy, due to a lack of robust data for the analysed period.
- Data prior to 2000 are not shown here due to a lack of robustness that makes it difficult to obtain a detailed analysis of the different effects.
- The calculation of the share of decarbonised electricity includes the consumption of electricity from renewable and nuclear production. The figures differ from Eurostat for 2 reasons: (1) Eurostat uses multipliers according to the mode of transport, (2) Eurostat does not take into account certain fuels in the total consumption of transport (e.g., jet fuel).