Request the full 2026 publication (free)
2026 Edition - Powering Growth, Not Emissions
Discover the new edition of our flagship report - Global Energy Trends - an exclusive analysis based on first-released 2025 consolidated statistics on energy and CO2 emissions, crafted by our (human) experts, leveraging our unique databases.
This year, our senior analysts have detailed the forces shaping energy and decarbonisation across the G20:
- Can global growth continue without increasing energy demand?
- Are renewables expanding fast enough to shift the balance?
- And why do fossil fuels still dominate despite progress?
Moreover, they offer you an exclusive analysis of the 2026 Iran conflict and its ripple effects across global energy systems. As the Strait of Hormuz crisis disrupts supply chains, oil and gas markets tighten, exposing Europe’s structural vulnerabilities. This report reveals the limits of costly short-term responses and highlights why accelerating the transition to a secure, low-carbon energy system is now critical to ensure long-term resilience.

Table of contents of the report:
For the full report, click on the button below
Extracts from the report:
2024 vs 2025 comparison of key energy and climate figures for G20 countries
G20 countries account for 80% of global energy consumption
Figures in orange: data for 2025
Figures in blue: data for 2024
Key Takeaways:
Progress on energy intensity and emissions remains too slow to meet climate targets. Although trends are moving in the right direction, the pace of change falls short of what is needed to align with long‑term objectives:
- Growth and energy demand have returned to pre‑crisis trends (respectively +3.3% and +1.4%), with no clear decoupling between economic activity and energy use. While energy consumption is rising more slowly than GDP, efficiency gains and structural shifts remain insufficient to break the link.
- Renewables are expanding rapidly (+29% of power production from solar, and +8% from wind), helping to slow the growth in energy demand and emissions, but not reversing it. Wind and solar continue to scale up and improve system efficiency, avoiding significant fossil fuel use, yet their impact is largely absorbed by rising global demand.
- Fossil fuels still dominate the energy mix, covering around 80% of G20 consumption. Despite progress in low‑carbon electricity, coal, oil and gas remain central across sectors, keeping the system CO₂‑intensive.
- Electricity demand is increasing steadily, driven nearly 3% by electrification and new uses such as electric vehicles and data centres. This growth reinforces the role of electricity in the transition, while raising the challenge of meeting demand with low‑carbon power.
- CO₂ emissions have stabilised overall, but without a sustained decline. Reductions in some areas, including industrial processes and renewable deployment, are offset by continued growth in fossil fuel combustion.
CO2 emissions (%/year) in G20 countries

Source: Enerdata, Global Energy & CO2 Data
In 2025, total CO2 emissions remained stable. Declines in industrial emissions, particularly in China, were offset by continued growth in combustion emissions, albeit at a slower pace. Renewables helped limit emissions, with wind and solar avoiding around 4 GtCO₂—half in China—while trends diverged across countries, with increases in the USA, Canada, Brazil and Indonesia.
FOCUS: War in Iran – What impacts on European energy systems.
Key Takeaways:
The Middle East conflict is reshaping global energy markets, echoing the tensions seen in 2022. The blockade of the Strait of Hormuz has disrupted a critical trade route, constraining supply and pushing oil and gas markets into imbalance. Prices have surged, while Europe faces renewed competition for limited resources, particularly in LNG markets.
In response, European governments have once again turned to tax cuts to shield households and businesses from rising costs. While these measures provide short-term relief, they remain costly and have limited impact on demand, especially in sectors like transport where consumption is largely inflexible.
This crisis highlights a deeper structural issue: Europe’s continued dependence on imported fossil fuels. Short-term actions alone cannot ensure stability. Lasting resilience will require a structural transformation of the energy system—accelerating renewable deployment, improving efficiency, and electrifying key uses such as transport and heating.
Ultimately, reducing reliance on volatile fossil fuel markets is essential not only to meet climate goals, but to strengthen Europe’s energy security and limit exposure to future geopolitical shocks.
The Strait of Hormus Crisis: A buffer-constrained supply shock
Key Takeaways:
The ongoing crisis has triggered a profound physical imbalance in global oil markets, moving beyond simple price volatility to actual supply deficits. Recent data from OPEC starkly illustrates the widening gap between global supply and demand. By the first half of 2026, the accumulated imbalance should reach an estimated one billion barrels. This deficit is further compounded by the logistical realities of global shipping, where delivery lags mean the full physical impact of the supply shock is only just materialising in importing markets. Traditional market buffers are severely constrained , and strategic reserve releases are insufficient to cover the massive shortfall. Consequently, even if the Strait of Hormuz is on the point to reopen, importing regions are likely to face sustained physical shortages as the market struggles to rebalance.
Global supply and demand of crude oil
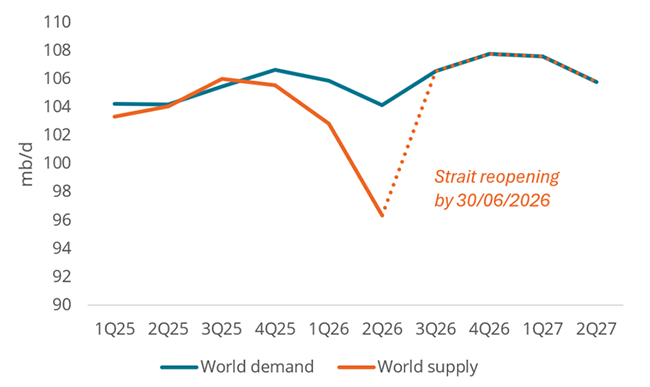
Source: OPEC, Enerdata
These contents are only a preview, to read the full and detailed report, you can request the full version “Global Energy Trends – Edition 2026” for free – Table of contents available above.
This report leverages several services from our Energy Intelligence & Data Platform, such as EnerMonthly
Discover the monthly trends in the energy landscape, including:
- Consolidated 2024 and 2025 data series – country benchmarking and year-on-year comparison:
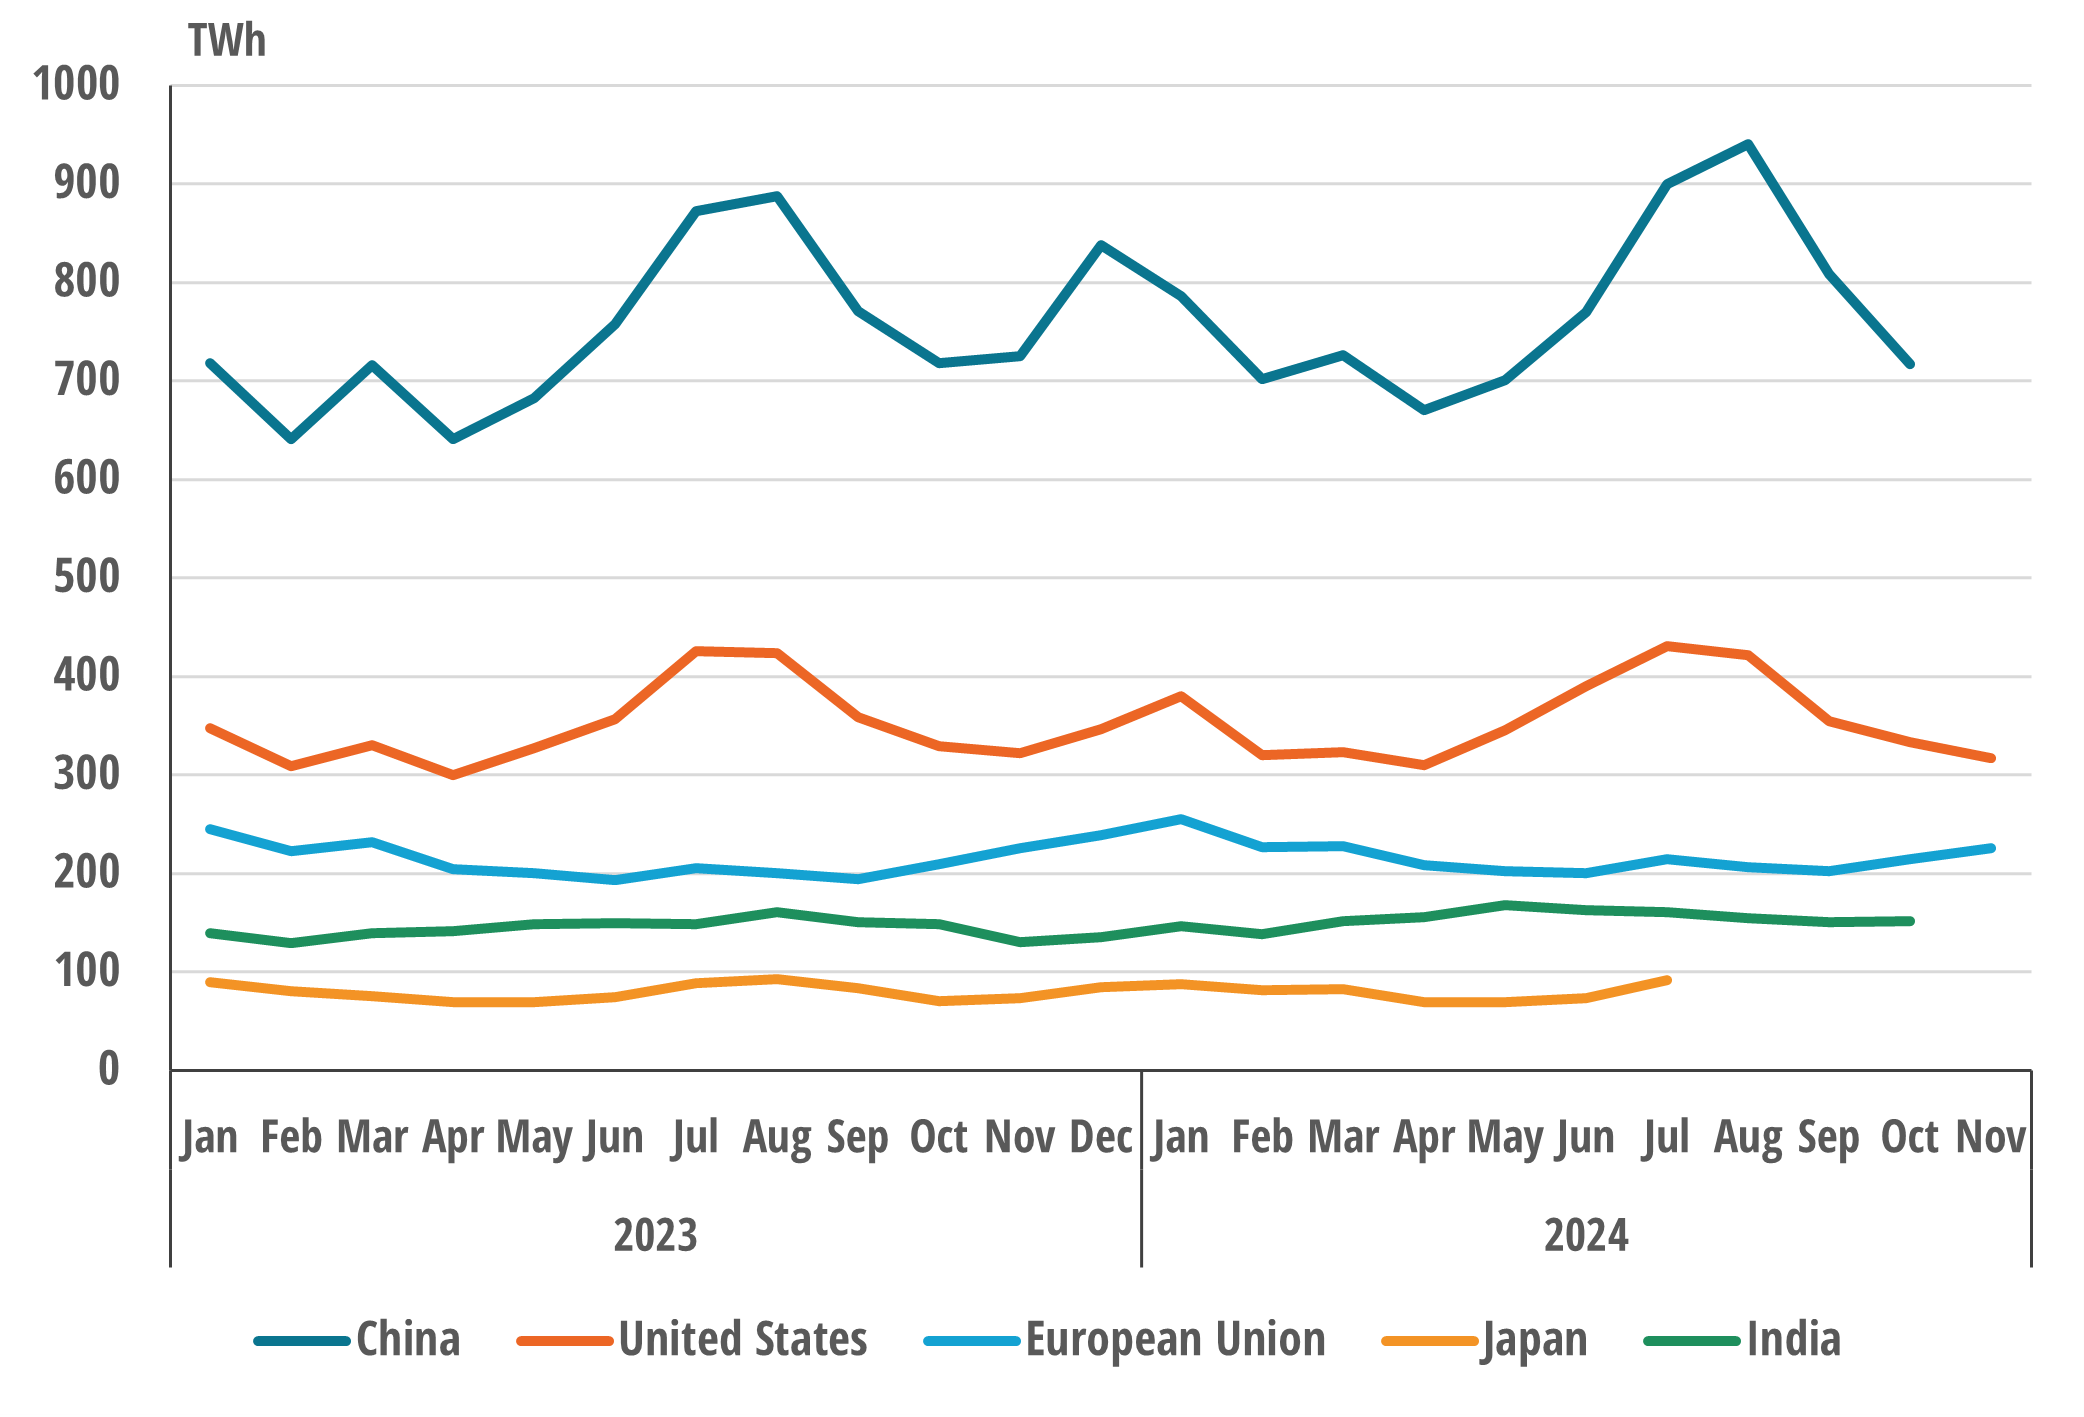
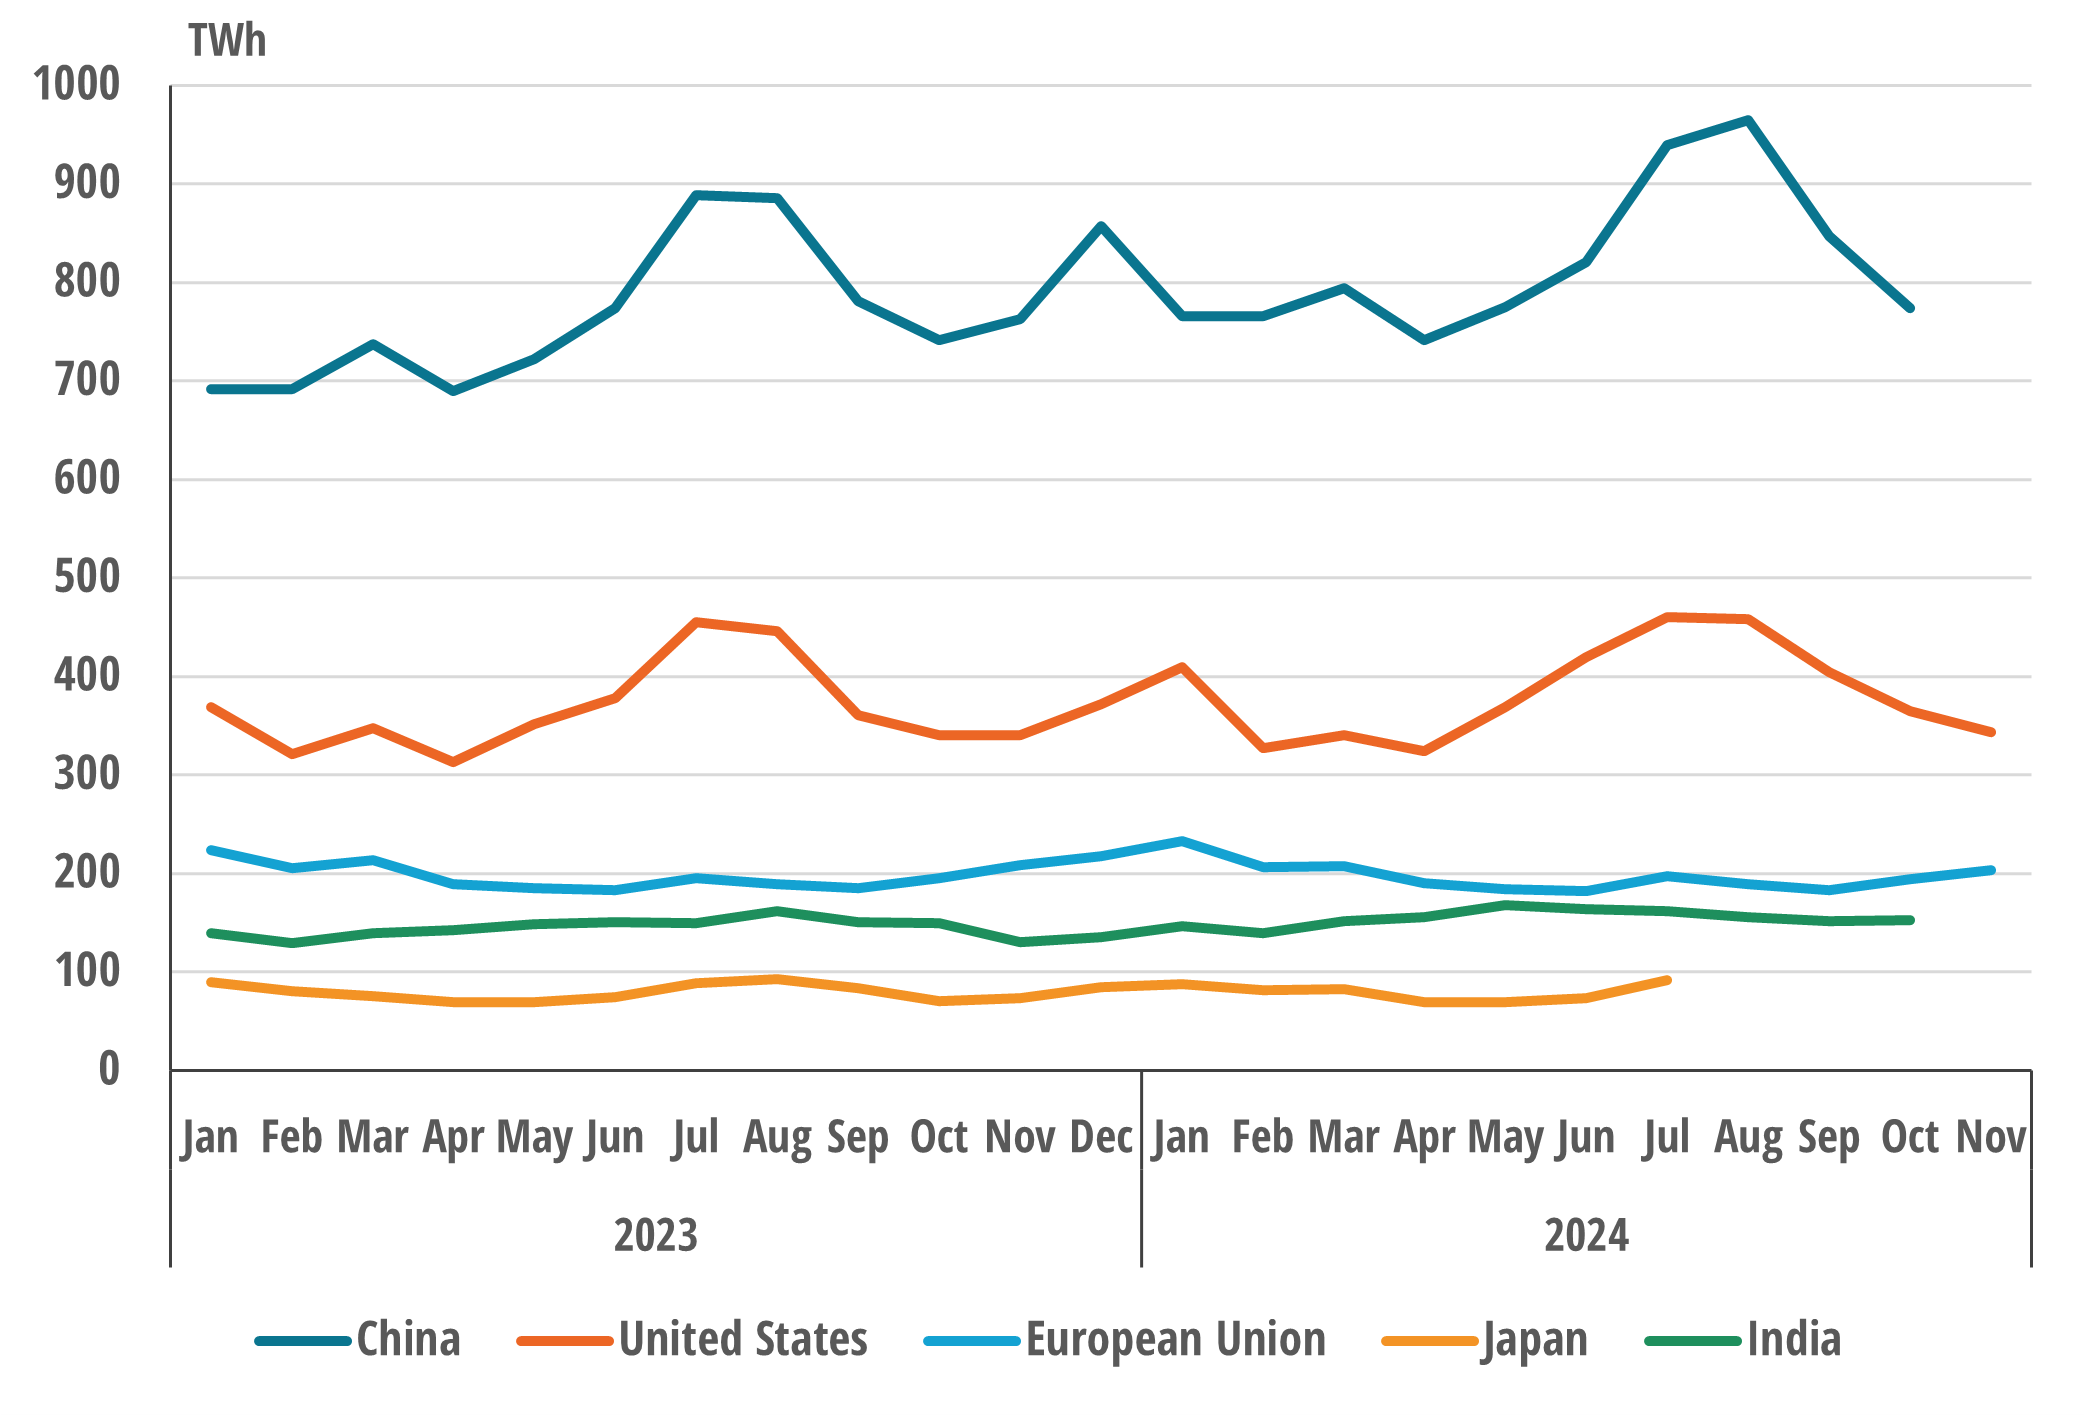
- Electricity snapshot: production and net consumption
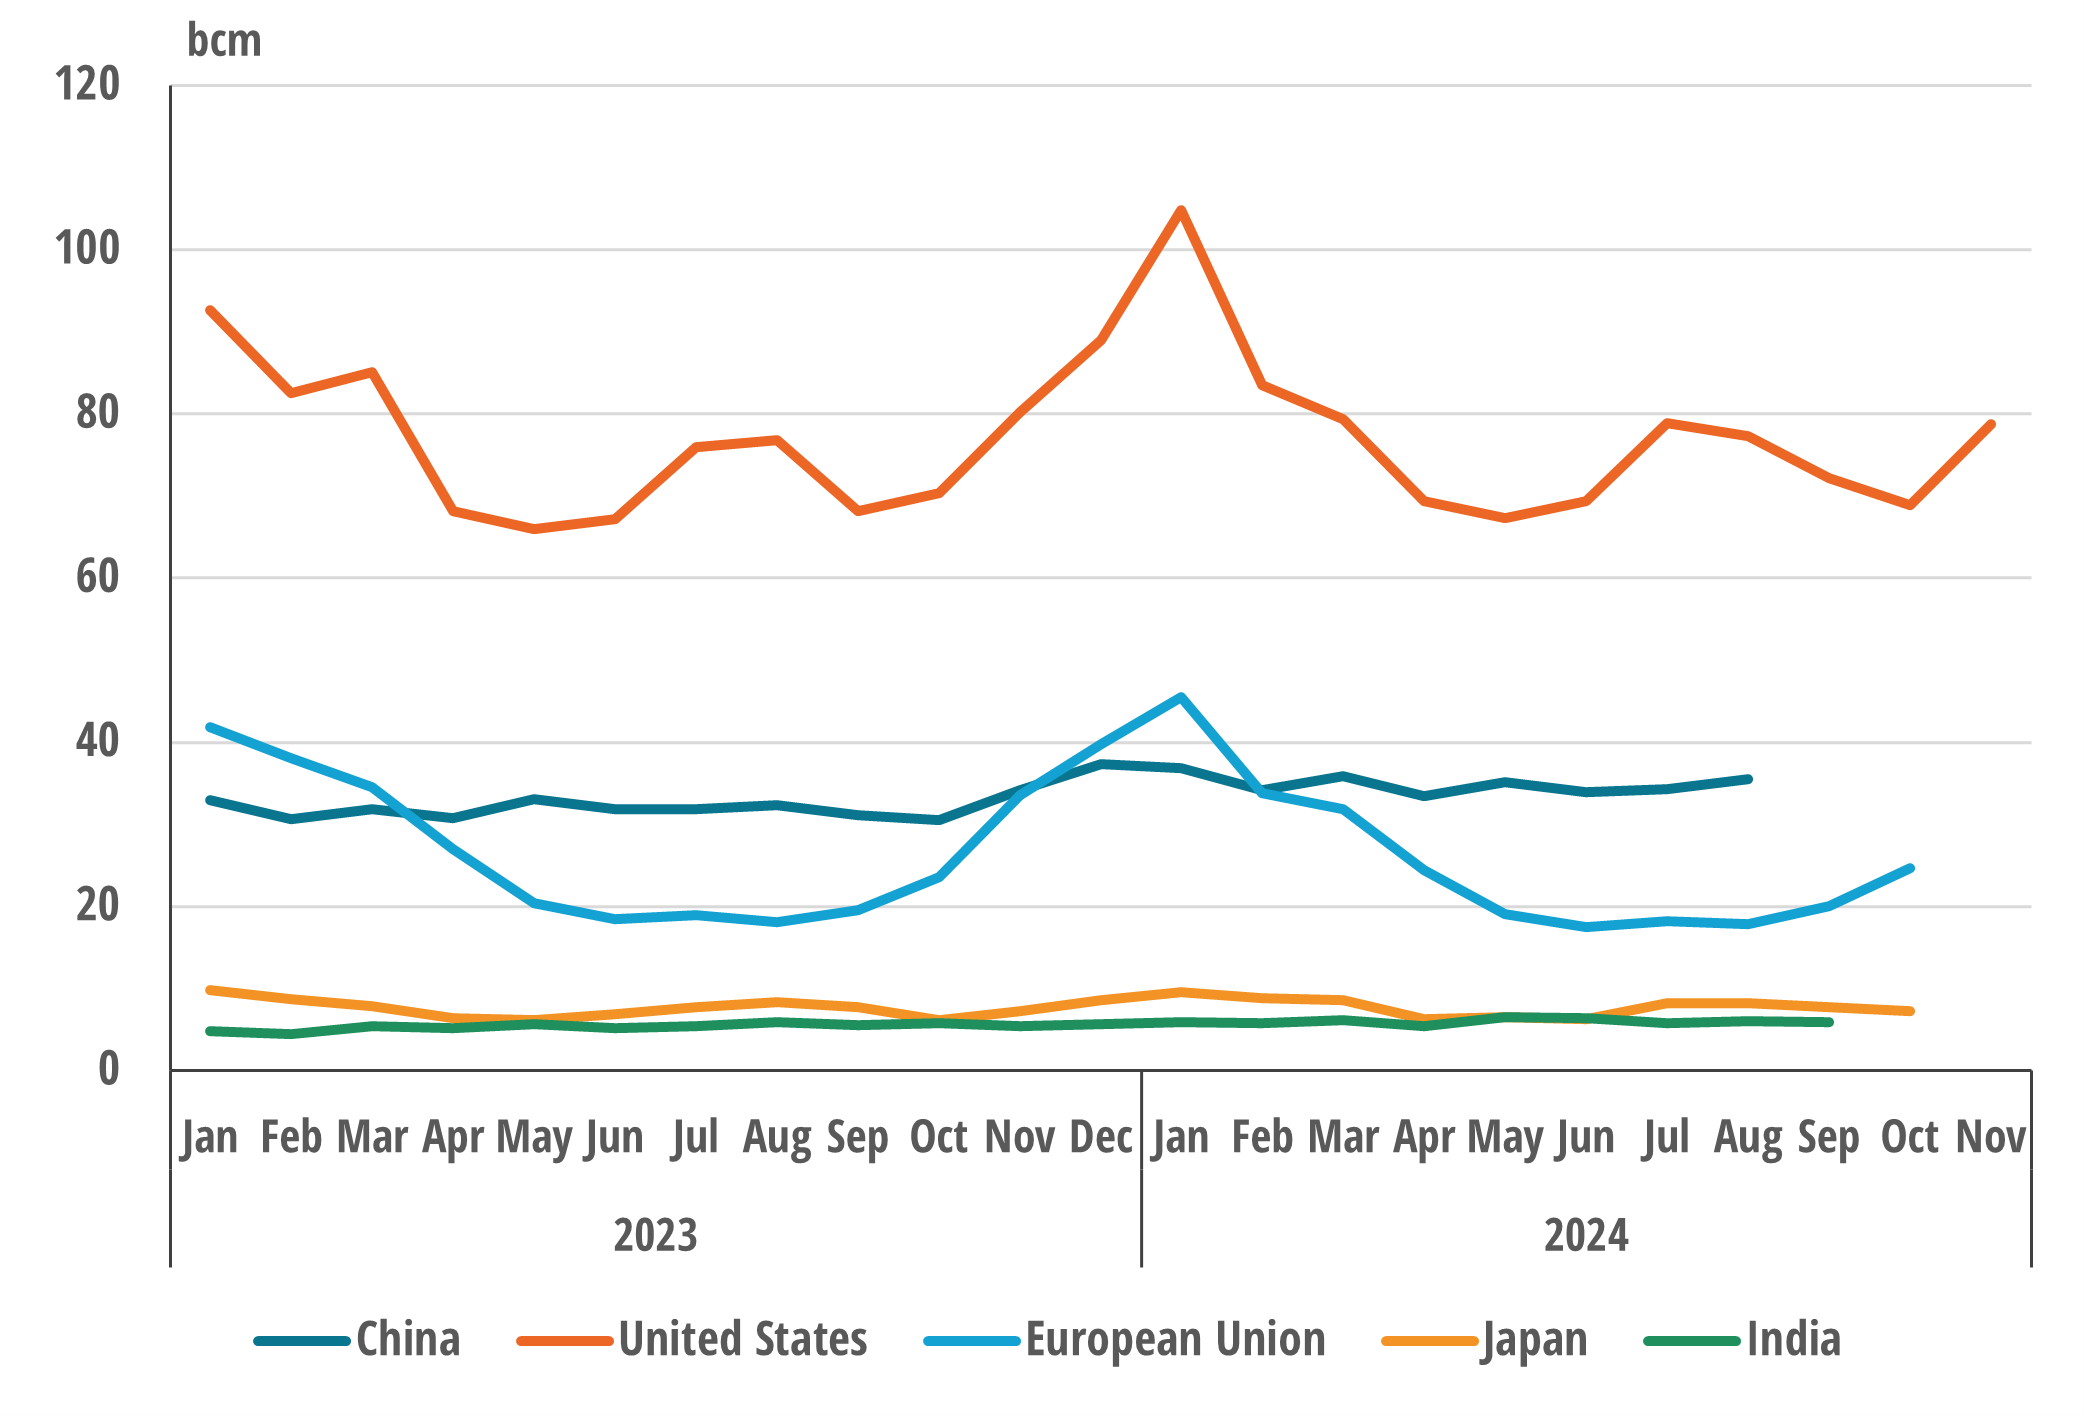
- Primary energy consumption by source: coal, oil, and natural gas
- Coverage: China, United States, European Union, India, and Japan
Source: Enerdata, EnerMonthly Database
Source: Enerdata, EnerMonthly Database
Source: Enerdata, EnerMonthly Database
Source: Enerdata, EnerMonthly Database