How will the demand for household air-conditioning evolve in the coming years?
Get this executive brief in pdf format
This month, we examine the determinants for air-conditioning demand and how this demand will be evolving given future economic, social and climatic parameters. Recurring warmer temperatures at the global level ensure that air-conditioning is and will stay very popular. Its diffusion depends not only on local climatic conditions but above all on the country’s economic situation. However, there is no linear relation between AC ownership and AC consumption, and the cultural factor plays the main role in this regard. Moreover, energy efficiency improvements (of AC units and buildings) can do a lot to mitigate electricity consumption for AC. And CO2 emissions from air-cooling also depend on the power mix carbon intensity.
This brief is by Enerdata’s Scientific Director and Co-Founder Bruno Lapillonne1.
Introduction
Warmer temperatures and economic growth drive the growing electricity consumption for household air-conditioning globally.
The average temperature of the planet in July 2019 was about 1°C above the 20th century average, according to NOAA, the United States (USA) National Oceanic and Atmospheric Administration. This makes it the warmest month on record. Actually, the last five years have been the five warmest.
This recurrence of warmer temperatures has a direct impact on the electricity consumption for air conditioning (AC): a 1°C increase raises it by around 15%. Thus, the AC consumption of the 20 most prosperous countries has increased by around 400 TWh over the last three years (2015-2018), as temperatures have been on average 6% higher than normal over the cooling period2: this excess consumption is equivalent to the present yearly consumption of buildings in Africa.
Moreover, most emerging countries, who often enjoy high economic growth, are located partly (e.g. China or India or coastal areas in Central and South America) or fully (South-East Asia, Sub-Saharan Africa) in tropical areas. Their demand for air cooling is continuously getting stronger to raise the comfort of the population.
The consumption of electricity for household air conditioning is growing very rapidly in half of the G20 countries: by more than 12%/year over 2000-2018 in China, India, Indonesia and Turkey, and in a range of 6 to 10%/year in Australia, Brazil, Canada, the EU, Saudi Arabia and South Korea. Only in the US and Japan, where the market is reaching saturation, is the progression much slower. As a result, cooling represents a large fraction of the residential electricity: above 60% in Saudi Arabia or the United Arab Emirates (UAE), around 20-25% in the USA and Malaysia (Figure 1).
Figure 1 : Share of air conditioning in household electricity use (2018)3
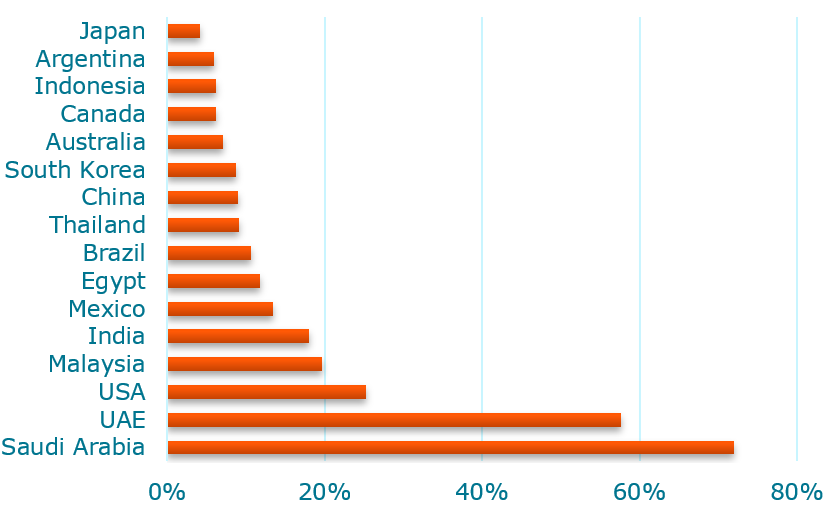
Source: Enerdata, EnerDemand the global efficiency and demand database
The prospects of future power demand for air cooling in the household sector depend on three main factors:
- The spread of AC equipment;
- The actual use of air conditioners;
- Energy efficiency improvements of air-cooling appliances and buildings.
The spread of air-cooling
The diffusion of AC appliances depends on the climate, on the level of development of the country (i.e. the household incomes) and on cultural habits.
To grasp the need for cooling, i.e. the climate dimension, we generally use the number of cooling degree days (CDD)4 the higher the value, the warmer the climate is. For instance, this number exceeds 2500 CDD in South-East Asia and stands between 800 and 1000 in China, USA and Brazil (Figure 2)5.
The correlation between the climate, i.e. the number of cooling degree days, and the ownership of AC appliances by household, as displayed in Figure 2, is in fact rather weak. Other factors are more important, notably the income: rich countries, such as the US and Japan, have a high penetration of AC appliances despite having an average number of cooling degree days much lower than some emerging countries.
The correlation between AC ownership and per capita GDP is generally better, except for China, which has a high ownership level compared to its average income, a level not fully explained by its climate (Figure 3)6. Cultural aspects explained what is not linked to climate or income.
Figure 2: AC ownership and climate
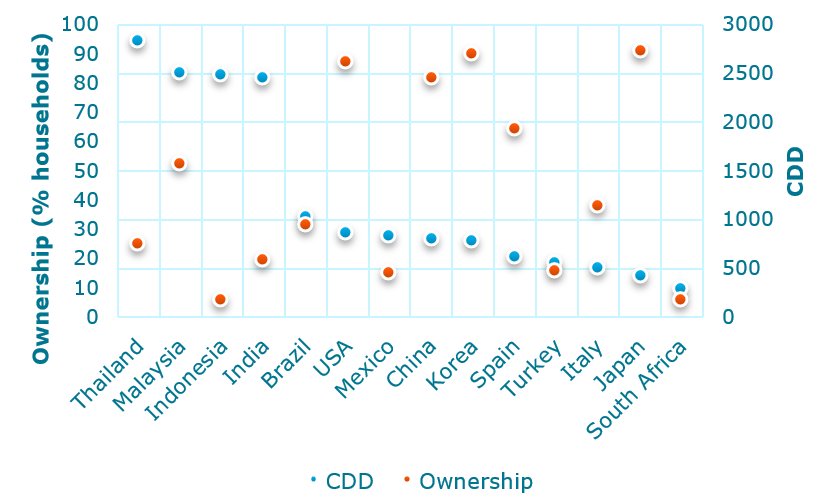
Figure 3: AC ownership and per capita GDP
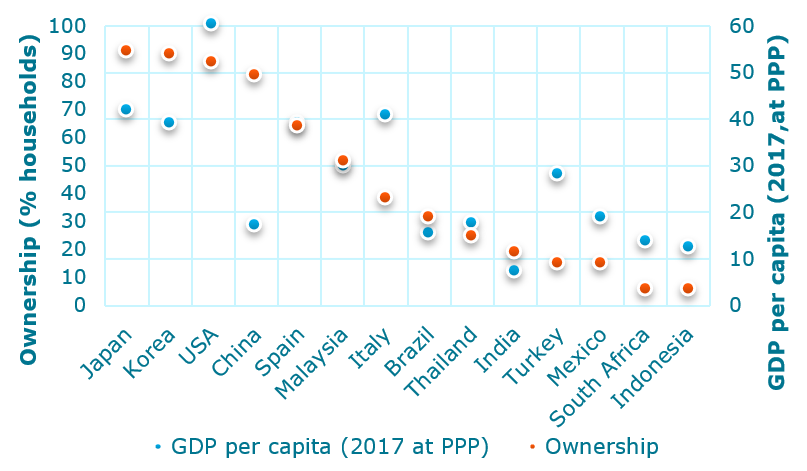
Source: Enerdata7 EnerDemand (only countries with AC ownership above 5% are shown)
The question is how this AC ownership will develop in the future. Though we could think that the progression would be faster in the warmest countries, past trends tell a slightly different story. Figure 4 displays the variation in the AC appliances ownership for households as a function of the cooling degree days. China has the largest increase when countries with a very warm climate have a more limited progression (e.g. Indonesia or even Thailand). However, the repetition of very hot summers will accelerate the acquisition of AC equipment across the board, except in countries which have reached saturation level such as the USA, Japan or South Korea, where little to no progression has been observed since 2010.
Figure 4: Variation in AC ownership between 2000 and 2018 and climate
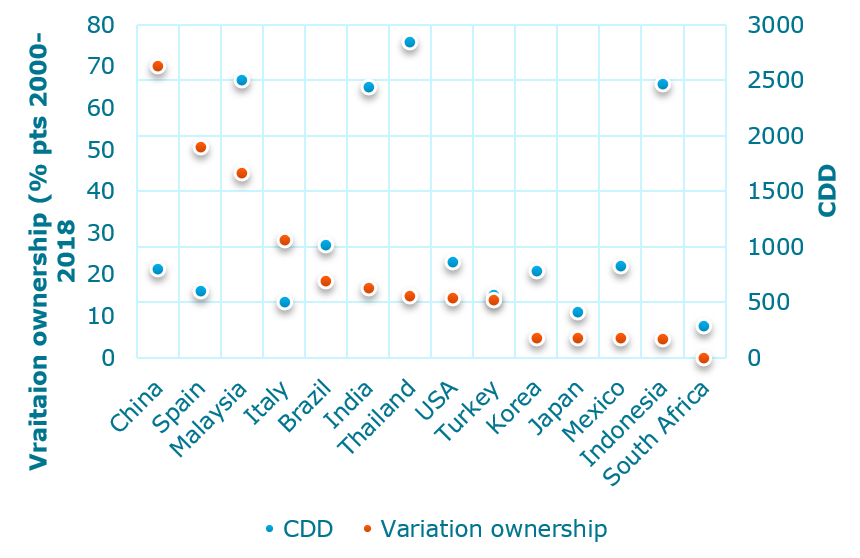
Source: Enerdata8 EnerDemand
Nonetheless, having an appliance does not necessary imply a large electricity use: it will depend on how the appliance is used, and there are large variations among countries in that respect.
Actual use of air conditioners
Several factors characterise the use of air conditioners and impact their electricity consumption:
- The number of air-conditioned rooms;
- The temperature setting;
- The number of hours of use.
The ownership of AC appliances as shown above indicate the level of diffusion but does not indicate the number of rooms that are air-conditioned in a dwelling. The most common practice is to have one or two split units, but in some countries most of the rooms are air-conditioned with a system of central air conditioning. The US is the extreme case with a very large diffusion of central AC systems since around 70% of US households have such an AC equipment9.
The temperature setting is a difficult issue as there are few data available to monitor the actual temperature selected by households in the different countries and as the perception of comfort varies quite a lot among countries, with a preference for lower indoor temperature in the USA, Central America or Asia, and higher temperature (between 23 and 26°C) in other regions, notably Europe and South America. And going from a temperature of 22 to 26°C decrease the electricity consumption by around 50%, all things being equal10.
The number of hours of use is again a typical cultural factor with households using the AC systems only in very hot periods and for a few hours and others having a much more intensive use of their AC appliances. For instance, a recent household survey in Mexico showed that 23% of households use their AC system for more than 9 hours per day, 39% between 5 and 9 hours and 38% for less than 5 hours11. Thus, household behaviour has a significant impact on the electricity demand.
Energy efficiency improvements
Energy efficiency improvements are two-pronged: they aim to reduce the electricity demand for AC with more efficient appliances and at the same time reduce the need for AC with more efficient buildings.
Most hot countries have already embarked in policy measures to raise the efficiency of AC appliances through labelling of the appliances, to orient the consumers toward the most efficient models when they buy a new appliance, and through the implementation of Minimum Energy Performance Standards (MEPS) by removing the least efficient appliances from the market. As a result of these policies the average energy efficiency12 of new AC appliances has increased by 50% since 1990 according to the IEA13.
Mexico is an example of a country that has successfully implemented MEPS for air conditioning. Figure 5 shows that the increase in the electricity consumption of households for AC has been moderated thanks to energy efficiency gains (i.e. energy savings).
Figure 5: Household AC electricity consumption in Mexico (2000-2015) (Mtoe)
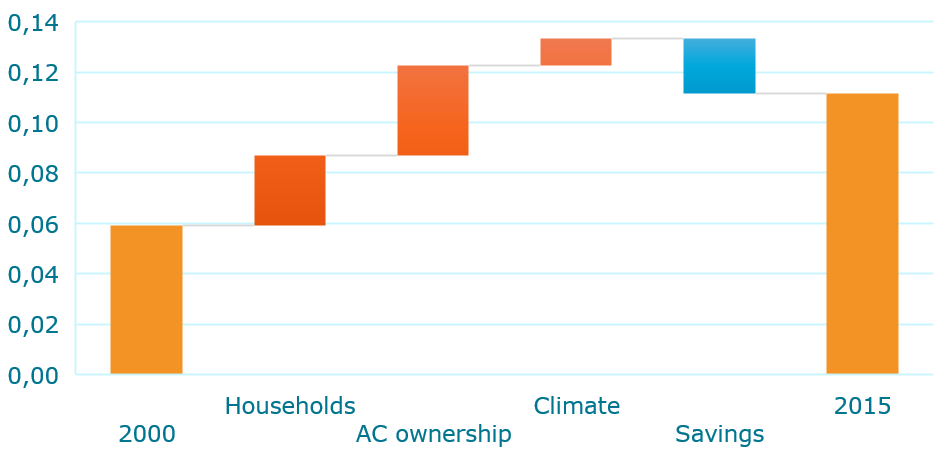
Source: CONUEE (CONUEE/ADEME project sponsored by AFD, 2018)
The other energy efficiency component is to reduce the need for cooling through more efficient new buildings: many emerging countries have adopted energy efficiency standards for buildings, but the enforcement rate is often low. This will have a limited impact on the long term, but such policies should be reinforced to avoid continuing constructing inefficient new buildings. In the OECD countries, where there is a tradition of standards for new buildings, the situation is potentially better. But the impact on the electricity consumption will be more limited, as new construction represents less than 1% of the total dwellings stock.
Conclusion
There is no doubt AC ownership will soar in the coming decades but the overall impact on CO2 emissions is uncertain, depending on the efforts in energy efficiencies and power mix decarbonization.
When looking at the future impacts of AC on energy systems and CO2 emissions the main drivers are:
- AC units growth, depending mainly on AC ownership but also changes in population or surfaces
- AC energy consumption per unit depending on technological improvements and energy efficiency measures, rise in global temperature, behaviour changes
- Power mix decarbonization
Regarding AC units growth, AC household ownership at global level could rise from 30% in 2016 to more than 60% in 2050 according to IEA. With no further efforts than existing energy efficiency policies, the consumption of electricity for cooling could be multiplied by four by 2050 in the residential sector14.
In an energy efficiency scenario, the electricity demand would be reduced by 45% compared to present levels thanks to greater improvements in the average efficiency of air conditioners (by almost a factor 2). Additional savings could come from efficiency improvements in the building shells as well as from efficient behaviors (temperature setting for instance); however, a better insulation of dwellings is more difficult to achieve, especially for existing dwellings because of its usually high cost, and also for new dwellings for which existing building regulations have turned out to be long to implement and enforce in most emerging countries .
Future CO2 emissions from AC will also depend on the level of decarbonization of the power mix. Taking into account the EnerFuture projections from Enerdata, the average emission factor of the power sector at world level could decrease in 2050 from around 500g CO2/kWh in 2017 to 380g CO2/kWh in the baseline scenario (EnerBase), 275g CO2/kWh in the EnerBlue scenario and even down to 90g CO2kWh in the ambitious EnerGreen scenario15.
Figure 6: Projections of emissions for air-cooling from electricity consumption in residential sector (MtCO2)
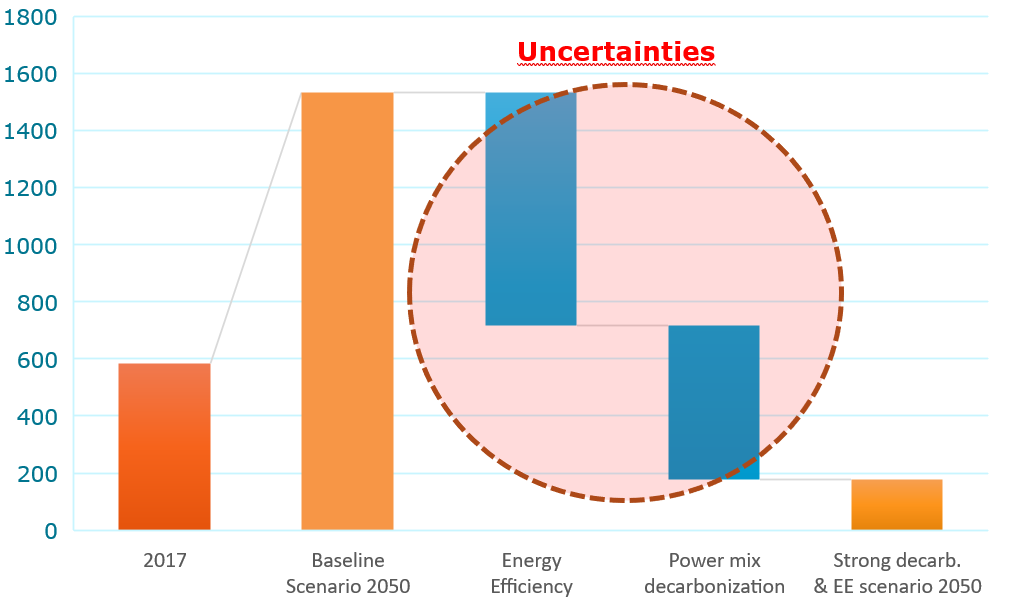
Source: Enerdata/IAE16.
CO2 emissions from electricity consumption due to air cooling in the residential sector could grow more than twofold by 2050 based on existing trends in energy efficiency and carbon content of the power mix. However, implementation of strong energy efficiency policies and a deep decarbonization of the power mix could change significantly the overall picture with a threefold decrease of CO2 emissions.
This high uncertainty around CO2 emissions subsists at the greenhouse gases (GHG) level. In addition to the CO2 energy related emissions, AC generates GHG emissions due to the gas used as refrigerant and their leakage. The future of these non-CO2 GHG emissions will depend on the success of policies and measures to remove these refrigerant gases or find alternatives with little greenhouse impact.
To summarise:
- A strong development of AC units is expected.
- How much electricity they will actually consume is highly uncertain and depends on energy efficiency policies both for the units themselves and the buildings they’re installed in. If existing policies continue, the consumption could be four times as high as today, while a strong new energy efficiency strategy could lead to an actual decrease.
- The same goes for CO2 emissions, which also depend on the level of decarbonisation of the power mix.
Footnotes:
- It supplements an article by Dr. Carine Sebi from Grenoble Ecole de Management (GEM) (https://theconversation.com/how-we-can-keep-our-planet-cool-even-as-a-c-use-rises-121421) and focuses more on household cooling.
- Estimation based on a comparison of the electricity consumption for cooling with a fictive value at normal climate, i.e. with climatic corrections (source: “EnerDemand, the global efficiency and demand database”, Enerdata).
- Only G20 countries with a share of AC above 4% are shown.
- This indicator adds over each day of the cooling period the difference between the daily outside temperature and a reference temperature (e.g. 20 in the US or 23°C in Europe).
- Source: EnerDemand from Enerdata. These values are national averages and the value can be much higher in certain regions of the country: for instance, the CDD of the West-South-Central region of the US (Arkansas, Louisiana, Oklahoma and Texas) is twice higher than the national average.
- A regression of the AC ownership with the number of cooling degree days and the average household income shows that the difference among countries is only explained by the income and only marginally by the number of degree days.
- Cooling Degree Days (CDD): “EnerDemand”; AC ownership: internal database from national sources; GDP per capita: “Global Energy & CO2 Data” based on World Bank.
- Cooling Degree Days (CDD): “EnerDemand”; AC ownership: internal database from national sources.
- Only 9% have one split unit and 12% have two or more units.
- Estimation by the author; the exact value depending on outside temperature, capacity of AC and building.
- INEGI, Encuesta Nacional sobre Consumo de Energéticos en Viviendas Particulares ENCEVI 2018.
- SEER: Seasonal Energy Efficiency Ratio
- IEA, The Future of Cooling, 2019.
- IEA, The Future of Cooling, 2019.
- EnerBlue assumes that the 2030 NDC are reached while EnerGreen is compatible with a temperature increase maintained below 1.5-2°C. For more information, see https://www.enerdata.net/research/forecast-enerfuture.html
- Baseline: EnerBase for decarbonisation of power mix + IEA Baseline for cooling demand. Strong decarbonisation and EE: EnerGreen for power mix+ IEA for cooling demand.