From Volume Growth to Structural Pressure
Request this Executive Brief in PDF format (FREE)
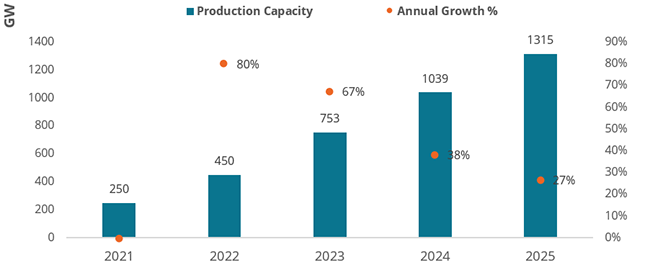
The global solar photovoltaic (PV) market entered a more demanding phase in 2025. After four years of rapid expansion, tracked module shipments declined for the first time, falling by 6% to 643 GW. Meanwhile global installations still reached a record 664 GW, lifting cumulative capacity to around 2.9 TW. The supply-side imbalance has deepened. Global nameplate module capacity reached 1,315 GW in 2025 more than double actual shipments, compressing utilisation rates and tightening margins across the industry1.
In Europe, the picture combines slowing deployment with a structural manufacturing gap. Installations edged down slightly in 2025 as cumulative capacity crossed 406 GW, but the more consequential challenge lies further up the value chain. Module production capacity has contracted to 10.8 GW, cell manufacturing remains negligible, and ingot and wafer production has effectively disappeared from the EU. The NZIA's 30 GW manufacturing target by 2030 remains distant for most value chain segments, worsened by the recent cancellation of several gigafactory projects.
Globally, demand remains robust, but is increasingly shaped by grid constraints, permitting delays and financing conditions rather than unconstrained volume growth. Additionally, 2025 marks a transition from volume-driven growth to a market where utilisation rates, supply chain localisation, and financial resilience define competitive positioning.
Contracting Module Shipment Market
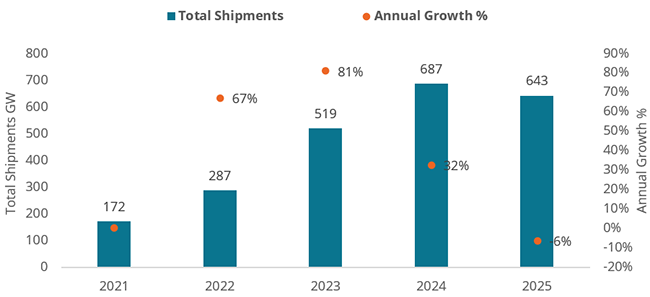
After four years of uninterrupted growth, global PV module shipments recorded their first contraction in 2025. The top manufacturers tracked by Enerdata shipped a combined 643 GW, down 6% from 687 GW in 2024, marking a clear turning point for a market that had expanded more than fourfold since 2021 (Fig. 1). This decline should be read with caution. Part of the market remains difficult to track, as many small and private manufacturers do not publicly disclose shipment volumes. In addition, some 2025 installations may have relied on inventories built up in previous years. Even so, the slowdown points to a more constrained deployment environment, shaped by grid congestion, limited storage, permitting delays, financing barriers, curtailment, and supply chain adjustments.Consequently, SolarPower Europe has lowered its Medium Scenario for global cumulative solar PV installations by 2030 from 7.1 TW to 6.6 TW2.
The path leading to this point had been exceptional. Tracked shipments rose from 172 GW in 2021 to 287 GW in 2022 (+67%), then surged to 519 GW in 2023 (+81%) before slowing to 32% growth in 2024. The 2025 contraction does not indicate a collapse in demand, as global solar installations remain historically high. It does, however, suggest that the market is moving from a phase of rapid volume expansion to one marked by saturation, price pressure, and consolidation.
Figure 1: Tracked PV Modules Shipments (40 largest companies WW) - GW
Source: Enerdata’s own calculation *Methodology1
The top five hold their positions; the top 2 players trade positions
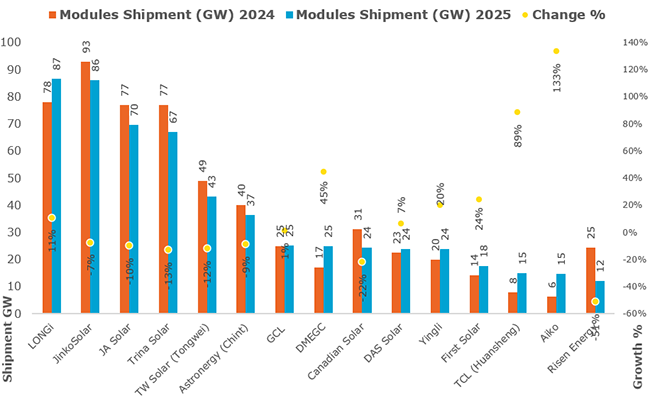
The ranking of leading module manufacturers changed little at the top in 2025. LONGi regained first place with 87 GW shipped, the only player among the top four to post growth, up 12% from 78 GW in 2024. JinkoSolar followed closely with 86 GW, down 8% from its 2024 market-leading level of 93 GW. JA Solar (70 GW, -9%) and Trina Solar (67 GW, -13%) completed the top four, both recording sizeable volume declines compared with 2024, when each shipped 77 GW. Taken together, the performance of the top four reflects the broader market contraction and marks a reversal for JinkoSolar and Trina Solar after their strong growth in the previous cycle (Fig. 2).
Among mid-tier players, the picture is more mixed. Canadian Solar was the standout performer, growing shipments 29% to 40 GW, one of the strongest year-on-year gains across the entire tracked field. In contrast, TW Solar (Tongwei) declined 12% to 43 GW, while Astronergy (Chint) fell 8% to 37 GW. DMEGC was another notable outperformer, expanding shipments 47% to 25 GW, while GCL held flat at 25 GW. DAS Solar grew modestly by 4% to 24 GW, and Yingli posted a solid 20% increase to 24 GW.
Figure 2: PV Modules Shipment 2024/2025 & Change %
Source: Enerdata’s own calculation *Methodology1
First Solar (18 GW, +29%) also outperformed the market. As the only non-Chinese manufacturer in the top fifteen, its growth was supported by the US domestic manufacturing push under the Inflation Reduction Act, even as the policy environment around that support has become less predictable. Although Canadian Solar is registered in Canada, its production facilities are predominantly based in China.
Risen Energy recorded the steepest decline among the tracked companies, with shipments falling 52% to 12 GW from 25 GW in 2024. Aiko recorded strong annual growth of 133% to 15 GW, while HuaYao increased shipments by 16% to 10 GW.
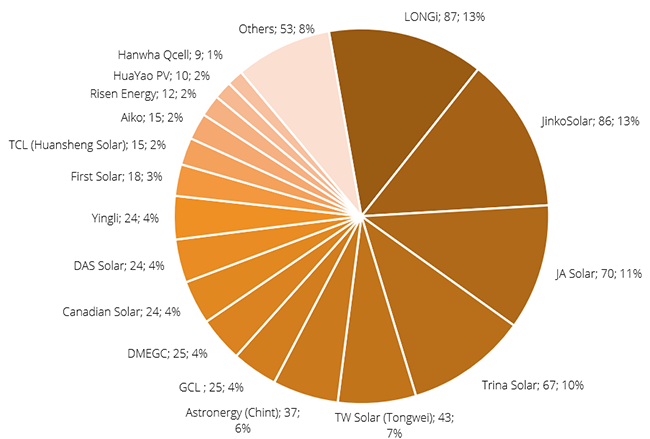
Figure 3 World Top PV Modules Shipment 2025 (GW) & (Share %)
Source: Enerdata’s own calculation *Methodology1
Record Global Annual Installations
Solar PV deployment reached 2.9 TW in 2025, with the 3 TW milestone approaching ahead of schedule
Global solar PV deployment is now moving at a pace with little historical precedent. It took nearly seven decades, from the first commercialisation of solar cells in 1954, to cross the 1 TW threshold. The second terawatt was added in just two years
In 2025, 664 GW was installed, taking total capacity to around 2.9 TW 2 and bringing the third terawatt within reach. By comparison, 449 GW were installed in 2023, followed by 597 GW in 2024, which has brought cumulative global capacity to 2.2 TW. Annual installation growth continues to slow, from 85% in 2022 to 12% in 2025, a trend expected to continue in the coming years.
Annual growth continues to soften, reaching 12% in 2025 with 664 GW of new additions
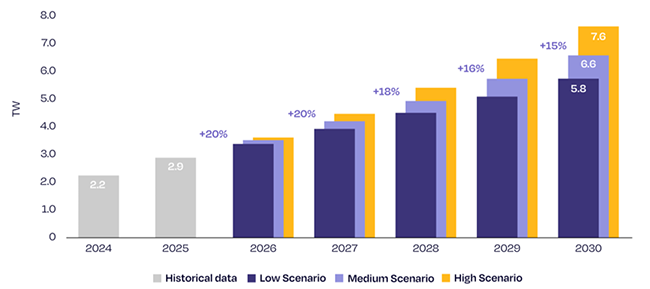
As the market matures and international supply chains continue to face geopolitical shocks, 2026 could bring further deceleration or even a minor contraction. Current scenarios place annual installations between 501 GW (-25%) and 724 GW (+9%) 1. This outlook reflects expectations of a weaker Chinese market, rising curtailment, and continued supply-chain adjustments. Looking further ahead, annual global installations are projected to reach 930 GW by 2029 under the Medium Scenario and could exceed 1.2 TW under the High Scenario. In both cases, a global solar market adding 1 TW per year appears possible before 2030. Cumulatively, these additions would put total solar capacity on track to exceed 6 TW by the end of the decade, strengthening solar PV’s role as the main contributor to the global 11 TW renewable energy target for 2030.
Figure 4: Global Cumulative Solar PV Market Outlook
Source: Solar Power Europe 2
However, despite the overall market deceleration projection, the recent blockage of Strait of the Hormuz has hiked demand for solar from China doubling exports in March to 68 GW3. Recent geopolitical developments could alter this outlook, as government are placing greater emphasis on energy security and the diversification away from fossil fuels. out of necessity, sovereignty or change of market dynamics.
Widening Gap Between Production Capacity and Utilisation
Production capacity continues to expand, now reaching 1,315 GW — with utilisation rates telling the real story
In contrast with the shipment contraction, global nameplate PV module production capacity continued to grow in 2025, reaching 1,315 GW, up 27% from 1,039 GW in 2024 (Fig. 5). Since 2021, total nameplate capacity has increased more than fivefold from 250 GW. This expansion, well ahead of actual shipment volumes, is a key driver of the industry’s profitability pressure. With 643 GW shipped against 1,315 GW of available capacity, the aggregate utilisation rate stands at roughly 49%, a level that makes healthy margins difficult to sustain for many manufacturers. 2024 has seen significant price drop in solar panel, drastically lowering the profitability of Chinese companies. Several large companies have recorded negative profits despite increased shipment4.
Figure 5: World Total Nameplate PV Modules Production Capacity (GW)
Source: Enerdata’s own calculation *Methodology1
This divergence between capacity and shipments is not new, but it is widening. In 2024, the top manufacturers shipped 687 GW against approximately 1036 GW of combined capacity, resulting in an utilisation rate of around 66%. The drop to roughly 49% in 2025 represents a meaningful operational deterioration, and one that is unevenly distributed across the competitive field. Companies continued investment in overcapacity is an evident symptom of market distortion resulted from substantial subsidies directed to this industrial sector in China. The solar industry in China, which dominates around 90% of the global supply chain, has received subsidies amounting to 3.2% of company revenues, compared to an average of 0.9% across 15 other key industries5.
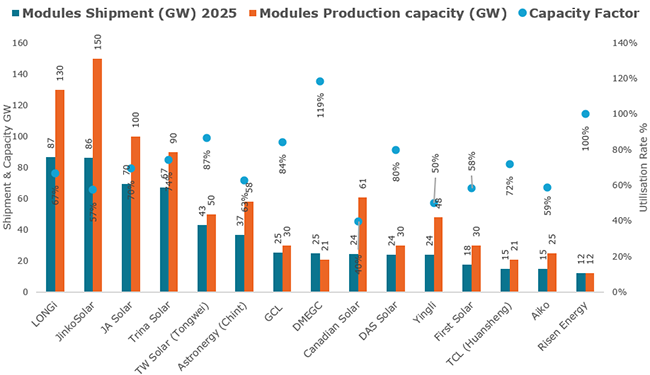
Nameplate production capacity continues to expand far faster than actual shipment volumes, and the divergence is sharpest among the largest players. LONGi's 67% utilisation rate against 130 GW of capacity and JinkoSolar's 57% against 150 GW illustrate the tension between scale investment and commercial absorption. JA Solar (70%) and Trina Solar (74%) maintained relatively tighter alignment between capacity and output — among the more disciplined ratios in the top four. TW Solar (Tongwei) stands out as the most capacity-efficient of the major Chinese manufacturers, running at 87% utilisation with 43 GW shipped against 50 GW of nameplate capacity. Canadian Solar similarly achieved approximately 80% utilisation, as did DAS Solar.
Figure 6 Annual Shipments Compared to Nameplate Production Capacity
Source: Enerdata’s own calculation *Methodology1
Among the manufacturers shown in the graph, Hanwha Qcells recorded one of the lowest utilisation rates, at 36%, after shipping 9 GW against 25 GW of nameplate capacity. Some smaller players also show very low utilisation levels, including Ronma at 16% and Runergy at 14%. These figures should be treated with caution and would require further verification, as public data on shipment and production capacity can be incomplete.
At the opposite end, DMEGC exceeded its rated capacity, shipping 25 GW against a nameplate of 21 GW — a utilisation rate above 100% that points to temporary production overshoots, outsourcing production or inventory drawdowns, marking the company as one of the more commercially aggressive smaller players in the current environment. Risen Energy similarly ran at full capacity (12 GW shipped, 12 GW nameplate), suggesting lean but fully committed production. Yingli and HuaYao PV both recorded 50% utilisation, while First Solar's 58% reflects a manufacturing base still ramping rather than one operating at steady state.
Zoom in on the European Landscape
EU solar installations contract for the first time in a decade, with 65.1 GW expected in 2025
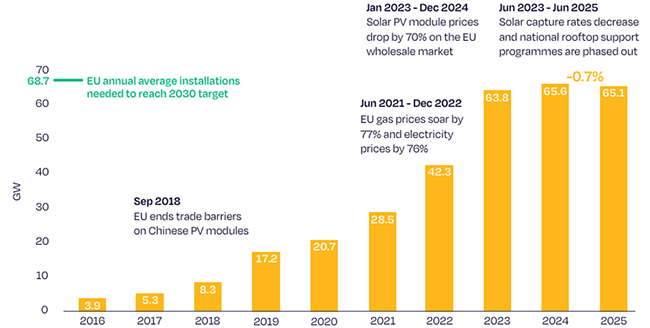
After a decade of near-uninterrupted expansion, the European solar market is entering a more turbulent phase, shaped less by new installation records than by the gap between deployment ambition and domestic industrial capacity. The EU is expected to install 65.1 GW of new solar PV capacity in 2025, marking the first annual market contraction in ten years. The slowdown had already begun in 2024, when growth eased sharply to 2.8%, reaching 65.6 GW after three years of exceptional expansion: +38% in 2021, +48% in 2022 and +51% in 2023. The 0.7% decline expected in 2025 shows that while the EU solar boom is still significant, but now under measurable pressure (Fig. 7).
Figure 7: EU Annual Solar PV Installations (GW)
Source: Solar Power Europe 6
Yet cumulative progress remains substantial. By year-end 2025, total installed EU solar PV capacity reached 406 GW, placing the bloc 1.6% above its own 400 GW milestone for 2025. This represents a fivefold increase from the 86 GW installed in 2015 and nearly triple the 2020 level of 141 GW, a testament to the speed of the previous expansion cycle. Looking further ahead, only the High Scenario projecting annual installations rising from roughly 70 GW in 2026 to more than 95 GW by 20306 would keep the EU on a trajectory consistent with its 2030 solar targets.
Europe's Solar Manufacturing Crossroads: Ambition Under Pressure
The NZIA sets a 30 GW manufacturing target; the gap between ambition and reality varies sharply by value chain segment
Beyond deployment, Europe’s more structural challenge is manufacturing. The Net-Zero Industry Act (NZIA)7, which entered into force on 29 June 2024, sets a target of at least 30 GW of domestic solar manufacturing capacity by 2030 at each stage of the value chain. This responds directly to the EU’s deep dependence on Chinese suppliers, which continue to dominate global module shipments.
The distance to that 30 GW target differs starkly across the value chain. Solar inverter manufacturing has long surpassed it, reaching 96 GW in 2025, underpinned by a mature European industry with solid footholds in international markets including the US and Australia. Polysilicon production, at 26 GW2, comes closest among manufacturing segments though capacity is concentrated in a single established company, a portion of which serves the semiconductor sector rather than PV.
Figure 8: EU Operational PV Module Manufacturers — Capacity (MW)
Source: Enerdata’s own calculation *Methodology1
For the rest of the chain, the challenge is considerably steeper. Module production capacity actually contracted this year, falling from 12.6 GW in 2024 to 10.8 GW in 2025, meaning it must roughly triple by 2030 to reach the NZIA threshold2. PV cell manufacturing, still at just 2 GW in 2025, faces an even more daunting trajectory: a 15-fold increase in five years. Cell producers are further constrained by the complete absence of ingot and wafer production within the EU, following the closure of several key players over the last two years — leaving European manufacturers entirely dependent on non-European imports for the critical middle stages of the value chain8.
Module segment sees closures and downward revisions, even as gigafactory projects move forward
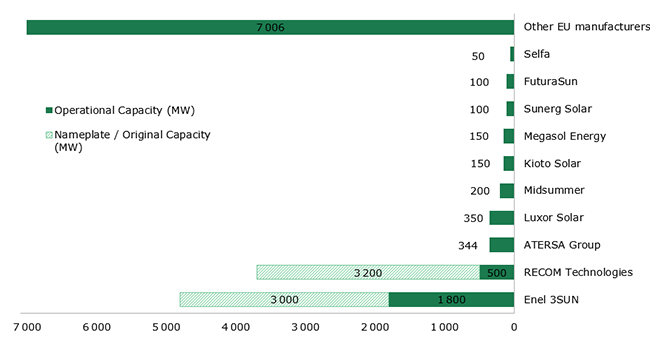
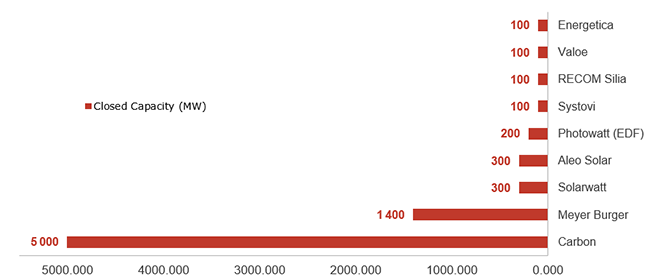
The 2025 contraction in EU module capacity reflects both statistical re-estimation and real industrial setbacks. The downward revision is largely linked to a reassessment of RECOM Technologies’ output, previously recorded at 3.2 GW but now understood to have peaked at around 500 MW before the company relocated operations from France to Italy in 2024. The segment also recorded several closures. French manufacturer Photowatt, one of the world’s oldest PV companies, ceased operations in early 2025 after years of losses and an unsuccessful sale process, while Aleo Solar, the German branch of Taiwan-based Sino-American Silicon, stopped module production in March 2025. If the announced module pipeline materialises, adding around 20 GW, EU module manufacturing could cover approximately 60% of the 2030 NZIA target.
Figure 9: EU Closed / Descaled PV Module Manufacturers — Capacity (MW)
Source: Enerdata’s own calculation *Methodology1
The gap between announced capacity and operational factories remains a major uncertainty in Europe's manufacturing outlook and, as the global context makes clear, closing that gap against a Chinese industry with deeply integrated supply chains, massive production scale, and continued cost advantages will require more than project announcements alone. May 2026 marked the cancellation of Carbon’s gigafactory in France, designed to build a 5 GW integrated solar manufacturing chain, citing insufficient regulatory visibility and investor guarantees9.
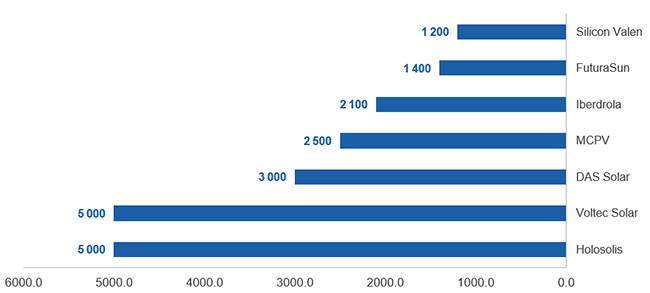
These Project closures stand in contrast to a pipeline of announced gigafactory projects that, if realised, could underpin the new module production capacity before 2030. Construction has already begun on DAS Solar's 3 GW plant in Mandeure, France. Additionally, a Chinese manufacturer establishes European production to navigate trade barriers, a pattern increasingly visible across the industry. Further projects include Holosolis (5 GW) and Voltec (5 GW) in France, MCPV (2.5 GW) and Iberdrola (2.1 GW) in Spain, and FuturaSun's 1.4 GW FENICE project in Italy. Enel's 3SUN gigafactory has already scaled module production capacity to 1.8 GW, offering a proof point for European-scale manufacturing viability.
Figure 10: Planned PV Module Gigafactories in Europe — Capacity (MW)
Source: Enerdata’s own calculation *Methodology1
KEY TAKEAWAYS
- Tracked module shipments fell 6% in 2025, from 687 GW to 643 GW, marking the first contraction after four years of exceptional growth.
- Global installations still hit a record 664 GW, lifting cumulative solar PV capacity to around 2.9 TW.
- The sector’s core imbalance deepened: 1,315 GW of module capacity versus only 49% average utilisation.
- Supply-demand imbalance and dominance of Chinese companies are partially attributed to heavy subsidies.
- Competition is becoming more selective, with LONGi leading at 87 GW and JinkoSolar close behind at 86 GW.
- Future growth is increasingly constrained by grids, storage, permitting, financing are curtailment risks.
- EU installations are expected to edge down to 65.1 GW in 2025, while cumulative capacity reaches 406 GW.
- Europe’s manufacturing gap remains acute: 10.8 GW of modules, 2 GW of cells, and no meaningful ingot or wafer capacity.
NOTES:
- Methodology: Enerdata built this analysis based on primary publicly available data mainly published by tracked companies in their annual reports and financial declaration report. Overall, 40 largest companies by shipments are being tracked to identify their production capacities and shipments. Private companies’ data are collected from news and announcements or estimated from market trends. Statistics are aggregated and rounded to reflect the market dynamics. Statistics are collected from several sources and cross checked in many cases while cumulative market stats are deduced, calculated or averaged from all identified sources. In case of any discrepancy, please notify Enerdata team with the right stats.
- Global Solar Market Outlook 2026-2030 - SolarPower Europe
- China’s solar exports double in a month | South China Morning Post
- China’s Solar PV Dominance & Global Shifts | Enerdata
- *Subsidies and the solar panel industry (EN)
- Report_EU_Solar_Market_Outlook_2025_2030_215fab8c9d.pdf
- Net Zero Industry Act - Internal Market, Industry, Entrepreneurship and SMEs
- PV Production in Europe
- Carbon scraps solar module gigafactory project in France - pv magazine Global