Among G7 countries, strong countervailing effects were observed between gas and coal in the USA and in Europe. The massive development of unconventional gas production in the USA has made domestic Henry Hub gas prices drop by 30% in 2012, from US$4/MMBtu on average in 2011 to US$2.75/MMBtu in 2012 (yearly averages). As a result, American power utilities realised a coal-to-gas switch to give priority to gas as the cheapest energy source.
Gas prices evolution on the three major markets
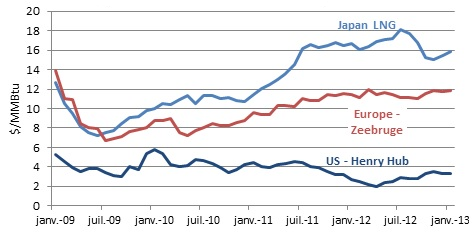
Source: Enerdata - Energy Prices Monitor
Consequently, overabundant US coal was exported at very competitive prices resulting in a coal price drop of 24% in Europe in 2012, from US$143/Mt in 2011 to in US$109/Mt in 2012. This produced a large substitution of gas to coal in power generation; the opposite move as observed in the USA. As a result, coal exports from the USA to Europe increased twofold in 2012 compared to 2011.
Coal price evolution in Europe
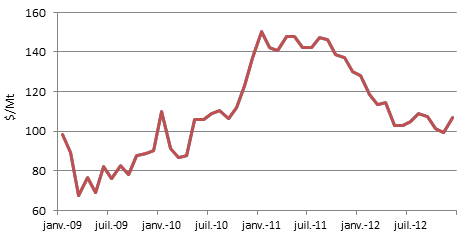
Source: Enerdata - Energy Prices Monitor
This change in the power mix was particularly marked in the United Kingdom (where coal increased from 30% to 40% in the electricity mix between 2011 and 2012), in the Netherlands (from 22% to 28%), in Spain (from 14% to 17%) and in Italy (from 17% to 19%). It is also true in Germany, where coal was already the major fuel. This massive increase in the use of coal, that is less efficient than natural gas for producing electricity, led to a drop in the average efficiency of thermal power plants in all these countries, with the highest reduction observed in the UK (from 44% in 2011 to 41% in 2012). These countries also experienced a subsequent increase in CO2 emissions from power generation (+ 10% of CO2 emissions per kWh produced in the UK between 2011 and 2012 for example).
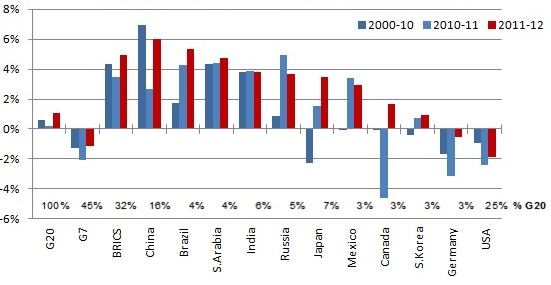
Coal consumption has globally slowed down, achieving a growth of 1.3% in 2012 compared to 5.9% in 2011. The worldwide deceleration in coal consumption is mainly due to changes in Chinese demand (2.5% in 2012 compared to 9.7% in 2011). China represents 50% of the total G20 coal consumption (3 470 Mt out of 6 960 Mt).
The second largest coal consumer, the USA, has reduced its use by a dramatic 11% (804 Mt consumed in 2012) while India, the third largest coal consumer, recorded a 9% increase well above the past decade average. In 2012, China, the USA and India together accounted for 72% of G20 coal consumption.
Coal demand growth in the G20 major countries (%/year)
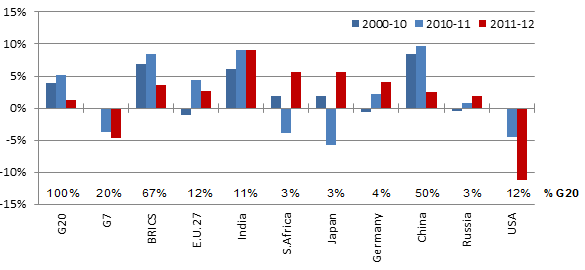
Source: Enerdata - Global Energy and CO2 Data
For the eleventh year in a row, with the exception of 2009, gas consumption increased in 2012. It rose at a pace of 2.6%/year, higher than the historical average of 2.1%. This trend was mainly driven by the U.S. demand, which represents a third of G20 consumption, with a +4.6% increase boosted by the use of shale gas. In Japan, gas consumption surged by 10.8%/year, close to the 11.6% recorded in 2011 following the Fukushima accident. In China, natural gas consumption grew half as fast as in 2011 and at a slower pace compared to the 2000’s decade (15.6% rise on average). South Korean gas consumption continued to progress by more than 8% in 2012, in line with its progression observed since 2000. Conversely, Russian gas consumption (20% of the G20 gas consumption) shrunk by 0.9% partly due the commissioning of efficient gas-fired plants (more than 6 GW of CCGT capacity were commissioned in 2011 and 2012, i.e. about 90% of the new gas-fired plant capacities). European gas consumption dropped by 1.9% with severe reductions in UK and Italy as a result of the substitution to coal in power generation. The cold winter in Europe partially offset the decrease in the gas consumption; this drop would have been even higher under normal climate conditions.
Gas demand growth in the G20 major countries (%/year)
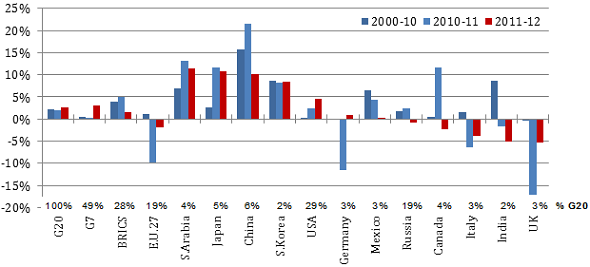
Source: Enerdata - Global Energy and CO2 Data
Oil demand increased by 1% driven by the largest energy consumers in Asia, with dynamic growth in China (+6%), India (3.8%) and Japan (3.5%); Latin American countries recorded significant increases, with Brazil (5.3%), Argentina (3.8%) and Mexico (3%); while Russian growth achieved 3.7%. With the development of shale gas, the USA kept their oil consumption trend heading downward with a decrease of 1.9%, following the 2.4% drop in 2011, leading the country to its lowest annual demand growth since 1992. European countries recorded the same reduction as in 2011 (-3.4 reflecting the weak European economy, high oil prices (US$112/bbl for the Brent on average in 2012), the continuing switch to natural gas in thermal uses as well as the growing penetration of efficient vehicles.
Oil demand growth in the G20 major countries (%/year)
Source: Enerdata - Global Energy and CO2 Data
After China overtook the US in power consumption in 2011, the BRICS caught up to the G7’s level in 2012 with around 6 800 TWh. The two entities have had opposite trends in power demand in 2012. Despite a lower power consumption growth in 2012, BRICS countries recorded an increase of 4.6% (more than 8% per year on average since 2000). G7 countries’ power consumption shrunk by 1.1% following the drop by 1.6% in 2011, with a reduction by 1.7% in the USA and 0.6% in Europe.
Yearly power consumption evolution
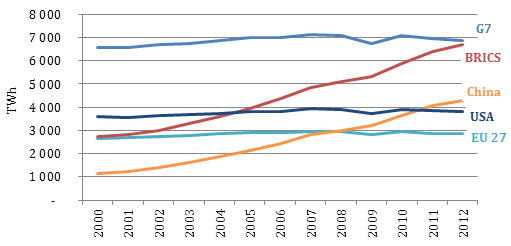
Source: Enerdata - Global Energy and CO2 Data